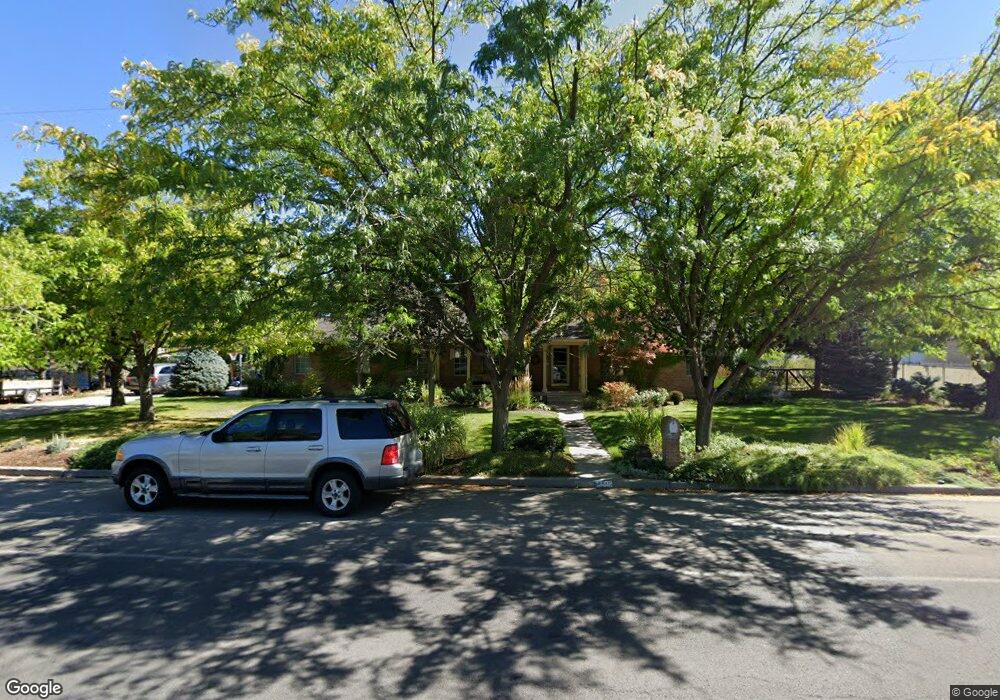
1486 N Main St Mapleton, UT 84664
Estimated Value: $623,000 - $693,000
5
Beds
3
Baths
3,440
Sq Ft
$192/Sq Ft
Est. Value
About This Home
This home is located at 1486 N Main St, Mapleton, UT 84664 and is currently estimated at $658,805, approximately $191 per square foot. 1486 N Main St is a home located in Utah County with nearby schools including Hobble Creek School, Mapleton Junior High School, and Maple Mountain High School.
Ownership History
Date
Name
Owned For
Owner Type
Purchase Details
Closed on
Aug 2, 2007
Sold by
Folster Scott O and Folster Analee S
Bought by
Newren L Scott L and Newren Anne M
Current Estimated Value
Purchase Details
Closed on
Mar 3, 2006
Sold by
Folster Scott and Folster Analee
Bought by
Folster Scott O and Folster Analee S
Home Financials for this Owner
Home Financials are based on the most recent Mortgage that was taken out on this home.
Original Mortgage
$157,000
Interest Rate
6.08%
Mortgage Type
Fannie Mae Freddie Mac
Create a Home Valuation Report for This Property
The Home Valuation Report is an in-depth analysis detailing your home's value as well as a comparison with similar homes in the area
Home Values in the Area
Average Home Value in this Area
Purchase History
| Date | Buyer | Sale Price | Title Company |
|---|---|---|---|
| Newren L Scott L | -- | Inwest Title Services Inc | |
| Folster Scott O | -- | Inwest Title Services Inc |
Source: Public Records
Mortgage History
| Date | Status | Borrower | Loan Amount |
|---|---|---|---|
| Previous Owner | Folster Scott O | $157,000 |
Source: Public Records
Tax History
| Year | Tax Paid | Tax Assessment Tax Assessment Total Assessment is a certain percentage of the fair market value that is determined by local assessors to be the total taxable value of land and additions on the property. | Land | Improvement |
|---|---|---|---|---|
| 2025 | $3,044 | $320,980 | -- | -- |
| 2024 | $3,044 | $298,155 | $0 | $0 |
| 2023 | $3,191 | $314,600 | $0 | $0 |
| 2022 | $3,599 | $350,790 | $0 | $0 |
| 2021 | $3,033 | $453,900 | $159,000 | $294,900 |
| 2020 | $3,009 | $435,600 | $140,700 | $294,900 |
| 2019 | $2,805 | $414,500 | $135,000 | $279,500 |
| 2018 | $2,519 | $354,300 | $113,700 | $240,600 |
| 2017 | $2,327 | $173,690 | $0 | $0 |
| 2016 | $2,162 | $160,435 | $0 | $0 |
| 2015 | $2,095 | $154,550 | $0 | $0 |
| 2014 | $2,054 | $148,775 | $0 | $0 |
Source: Public Records
Map
Nearby Homes
- 1350 N Main St
- 145 W Carnesecca Ct
- 1567 N 600 E Unit 26
- 435 E 1000 N
- 1697 N 500 W
- 598 W 1600 N
- 594 E 1000 N
- 265 E 600 N
- 1096 Valley Sage Dr
- 1839 River Bottom Rd
- 1092 Valley Sage Dr
- 667 N 550 W
- 84 E 530 N
- 1618 E 970 S
- 405 W 1200 N Unit 4
- 487 W 1200 N Unit 1
- 775 N 800 E
- 1518 E Pheasant Run Dr
- 1096 N 1000 E
- 829 S 2200 E
Your Personal Tour Guide
Ask me questions while you tour the home.