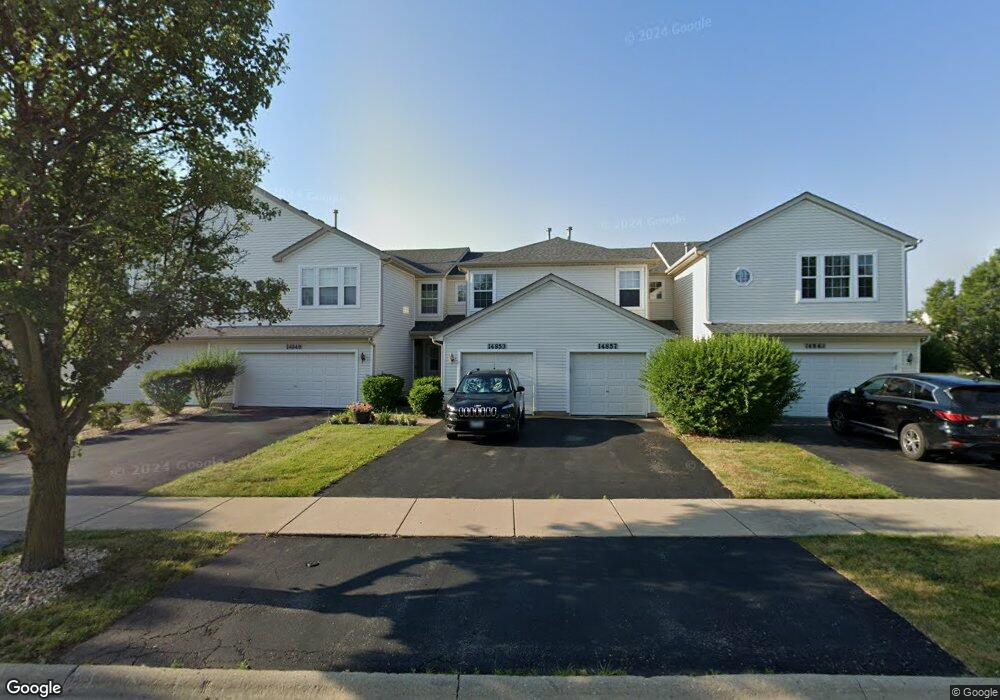
14861 W Victoria Crossing Unit 5 Lockport, IL 60441
South Homer Glen NeighborhoodEstimated Value: $265,266 - $327,000
--
Bed
--
Bath
1,665
Sq Ft
$182/Sq Ft
Est. Value
About This Home
This home is located at 14861 W Victoria Crossing Unit 5, Lockport, IL 60441 and is currently estimated at $302,317, approximately $181 per square foot. 14861 W Victoria Crossing Unit 5 is a home located in Will County with nearby schools including William E Young School, Hadley Middle School, and Homer Jr High School.
Ownership History
Date
Name
Owned For
Owner Type
Purchase Details
Closed on
Oct 5, 2007
Sold by
Abdel Razik Gina M and Abdel Razik Sajie A
Bought by
Ryan Kevin
Current Estimated Value
Home Financials for this Owner
Home Financials are based on the most recent Mortgage that was taken out on this home.
Original Mortgage
$160,300
Outstanding Balance
$101,589
Interest Rate
6.5%
Mortgage Type
Purchase Money Mortgage
Estimated Equity
$200,728
Purchase Details
Closed on
Nov 16, 2001
Sold by
Montalbano Builders Inc
Bought by
Abdel Razik Sajie A and Abdel Razik Gina M
Home Financials for this Owner
Home Financials are based on the most recent Mortgage that was taken out on this home.
Original Mortgage
$150,685
Interest Rate
7.07%
Mortgage Type
FHA
Create a Home Valuation Report for This Property
The Home Valuation Report is an in-depth analysis detailing your home's value as well as a comparison with similar homes in the area
Home Values in the Area
Average Home Value in this Area
Purchase History
| Date | Buyer | Sale Price | Title Company |
|---|---|---|---|
| Ryan Kevin | $200,500 | None Available | |
| Abdel Razik Sajie A | $155,500 | First American Title |
Source: Public Records
Mortgage History
| Date | Status | Borrower | Loan Amount |
|---|---|---|---|
| Open | Ryan Kevin | $160,300 | |
| Previous Owner | Abdel Razik Sajie A | $150,685 |
Source: Public Records
Tax History Compared to Growth
Tax History
| Year | Tax Paid | Tax Assessment Tax Assessment Total Assessment is a certain percentage of the fair market value that is determined by local assessors to be the total taxable value of land and additions on the property. | Land | Improvement |
|---|---|---|---|---|
| 2024 | $5,783 | $74,410 | $12,038 | $62,372 |
| 2023 | $5,783 | $67,449 | $10,912 | $56,537 |
| 2022 | $5,334 | $62,978 | $10,189 | $52,789 |
| 2021 | $5,077 | $59,666 | $9,653 | $50,013 |
| 2020 | $5,045 | $57,471 | $9,298 | $48,173 |
| 2019 | $4,886 | $55,287 | $8,945 | $46,342 |
| 2018 | $4,740 | $53,319 | $8,842 | $44,477 |
| 2017 | $4,649 | $51,826 | $8,594 | $43,232 |
| 2016 | $4,536 | $50,097 | $8,307 | $41,790 |
| 2015 | $4,317 | $48,216 | $7,995 | $40,221 |
| 2014 | $4,317 | $46,392 | $7,830 | $38,562 |
| 2013 | $4,317 | $46,392 | $7,830 | $38,562 |
Source: Public Records
Map
Nearby Homes
- 16601 S Windsor Ln Unit T1611
- 16663 S Windsor Ln Unit T1644
- 15053 Sagebrush Ln Unit 1254
- 14443 Etchingham Dr
- 16515 S Farmington Ln
- 15326 W Harvest Ln
- 14414 W 167th St
- 16609 S Silo Bend Dr
- 16860 S Ivy Ln
- 16508 S Brook Ln
- 16001 S Leach Dr Unit 3
- 16947 S Timber Dr
- 14549 W 159th St
- 16340 S Alberta Ct
- 15100 W 159th St
- 15949 S Windmill Dr
- 0B W 159th St
- 14858 W Glen Crest Ln
- 15355 W 159th St
- 1260 W 159th St
- 14853 W Victoria Crossing Unit T1773
- 14857 W Victoria Crossing Unit T1774
- 14849 W Victoria Crossing Unit T1772
- 16517 S Windsor Ln Unit T1571
- 16521 S Windsor Ln Unit T1573
- 16527 S Windsor Ln Unit T1576
- 16525 S Windsor Ln Unit T1575
- 16523 S Windsor Ln Unit T1574
- 16519 S Windsor Ln Unit T1572
- 14829 W Victoria Crossing Unit T1762
- 14833 W Victoria Crossing Unit T1763
- 14837 W Victoria Crossing Way
- 14829 W Victoria Crossing Unit WAY
- 14833 W Victoria Crossing Unit WAY
- 14829 W Victoria Crossing Unit 1482
- 14837 W Victoria Crossing Unit T1764
- 14825 W Victoria Crossing Unit T1761
- 14841 W Victoria Crossing Unit T1765
- 14841 W Victoria Crossing Way
- 14825 W Victoria Crossing Way