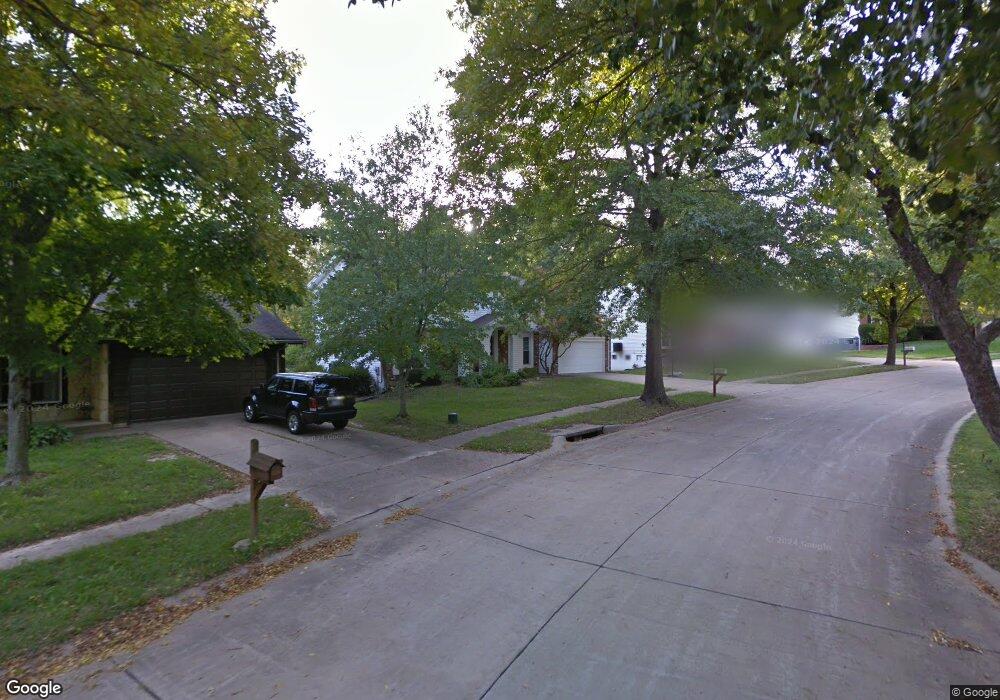
14866 Rutland Cir Chesterfield, MO 63017
Estimated Value: $448,103 - $496,000
4
Beds
4
Baths
2,042
Sq Ft
$231/Sq Ft
Est. Value
About This Home
This home is located at 14866 Rutland Cir, Chesterfield, MO 63017 and is currently estimated at $472,276, approximately $231 per square foot. 14866 Rutland Cir is a home located in St. Louis County with nearby schools including Shenandoah Valley Elementary, Parkway Central Middle School, and Parkway Central High School.
Ownership History
Date
Name
Owned For
Owner Type
Purchase Details
Closed on
Jul 15, 2011
Sold by
Zeng Dexing and Zhang Xuan
Bought by
Wang Dafu and Zhu Qin
Current Estimated Value
Home Financials for this Owner
Home Financials are based on the most recent Mortgage that was taken out on this home.
Original Mortgage
$184,000
Outstanding Balance
$126,646
Interest Rate
4.52%
Mortgage Type
New Conventional
Estimated Equity
$345,630
Purchase Details
Closed on
Aug 16, 2010
Sold by
Prudential Relocation Inc
Bought by
Zeng Dexing and Zhang Xuan
Home Financials for this Owner
Home Financials are based on the most recent Mortgage that was taken out on this home.
Original Mortgage
$170,000
Interest Rate
3.5%
Mortgage Type
New Conventional
Purchase Details
Closed on
Aug 15, 2002
Sold by
Block Betty J
Bought by
Wei Baoxian and Su Xizhen
Home Financials for this Owner
Home Financials are based on the most recent Mortgage that was taken out on this home.
Original Mortgage
$170,000
Interest Rate
6.48%
Create a Home Valuation Report for This Property
The Home Valuation Report is an in-depth analysis detailing your home's value as well as a comparison with similar homes in the area
Home Values in the Area
Average Home Value in this Area
Purchase History
| Date | Buyer | Sale Price | Title Company |
|---|---|---|---|
| Wang Dafu | $230,000 | None Available | |
| Zeng Dexing | $231,500 | Sec | |
| Prudential Relocation Inc | $231,500 | Sec | |
| Wei Baoxian | $213,000 | -- |
Source: Public Records
Mortgage History
| Date | Status | Borrower | Loan Amount |
|---|---|---|---|
| Open | Wang Dafu | $184,000 | |
| Previous Owner | Zeng Dexing | $170,000 | |
| Previous Owner | Wei Baoxian | $170,000 |
Source: Public Records
Tax History Compared to Growth
Tax History
| Year | Tax Paid | Tax Assessment Tax Assessment Total Assessment is a certain percentage of the fair market value that is determined by local assessors to be the total taxable value of land and additions on the property. | Land | Improvement |
|---|---|---|---|---|
| 2025 | $4,473 | $76,150 | $41,590 | $34,560 |
| 2024 | $4,473 | $67,560 | $22,190 | $45,370 |
| 2023 | $4,291 | $67,560 | $22,190 | $45,370 |
| 2022 | $3,955 | $56,640 | $22,190 | $34,450 |
| 2021 | $3,938 | $56,640 | $22,190 | $34,450 |
| 2020 | $4,037 | $55,770 | $19,970 | $35,800 |
| 2019 | $3,949 | $55,770 | $19,970 | $35,800 |
| 2018 | $3,739 | $48,950 | $19,970 | $28,980 |
| 2017 | $3,637 | $48,950 | $19,970 | $28,980 |
| 2016 | $3,594 | $45,960 | $14,270 | $31,690 |
| 2015 | $3,767 | $45,960 | $14,270 | $31,690 |
| 2014 | $3,360 | $43,810 | $10,960 | $32,850 |
Source: Public Records
Map
Nearby Homes
- 15261 Springrun Dr
- 1226 Luray Dr
- 1251 Still House Creek Rd
- 14616 Rogue River Dr
- 15324 Appalachian Trail
- 1237 Cedar Creek Rd
- 14361 White Birch Valley Ln
- 384 Greentrails Dr S
- 14424 Valley Meadow Ct W
- 1123 Cabinview Ct
- 1110 Nooning Tree Dr
- 14663 Mallard Lake Dr
- 1507 Timberlake Manor Pkwy
- 14629 Timberlake Manor Ct
- 14560 White Birch Valley Ln
- 15000 S Outer 40 Rd
- 14300 Conway Meadows Ct E Unit 302
- 15509 Hitchcock Rd
- 445 Whitestone Farm Dr
- 14144 Baywood Villages Dr
- 14872 Rutland Cir
- 14860 Rutland Cir
- 14854 Rutland Cir
- 14878 Rutland Cir
- 14859 Rutland Cir
- 14902 Rutland Cir
- 14901 Rutland Cir
- 14848 Rutland Cir
- 14811 Conway Rd
- 14847 Rutland Cir
- 14907 Rutland Cir
- 14908 Rutland Cir
- 14842 Rutland Cir
- 1296 Luray Dr
- 14815 Conway Rd
- 1331 Saltbox Dr
- 14915 Rutland Cir
- 1325 Saltbox Dr
- 14914 Rutland Cir
- 1290 Luray Dr