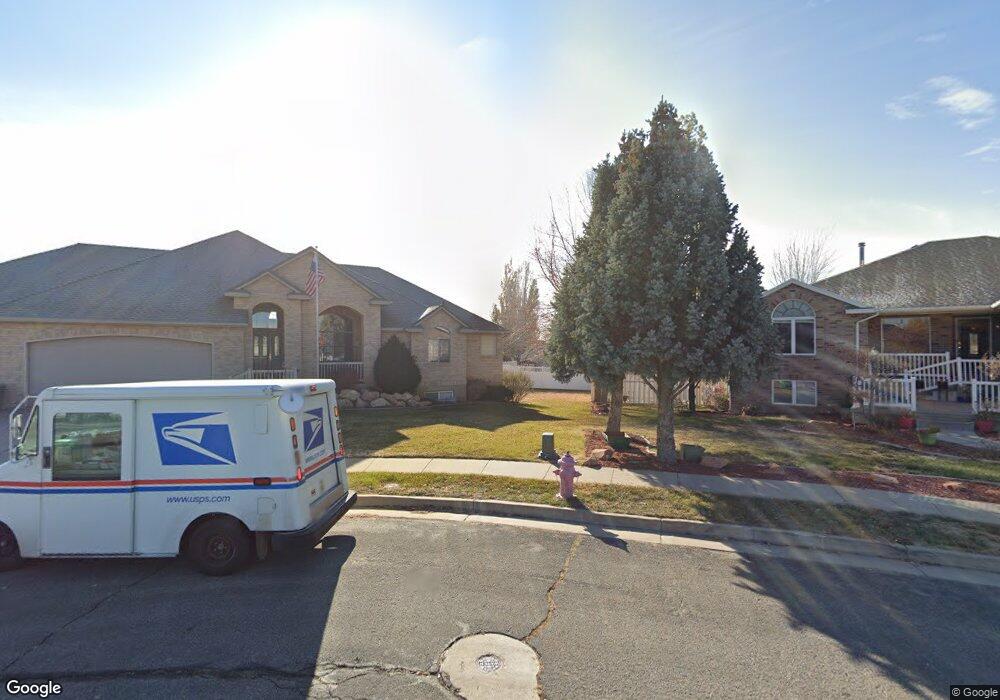
1488 N 2150 W Clearfield, UT 84015
Estimated Value: $484,000 - $570,785
5
Beds
4
Baths
2,821
Sq Ft
$190/Sq Ft
Est. Value
About This Home
This home is located at 1488 N 2150 W, Clearfield, UT 84015 and is currently estimated at $537,196, approximately $190 per square foot. 1488 N 2150 W is a home located in Davis County with nearby schools including Parkside Elementary School, West Point Junior High School, and Clearfield High School.
Ownership History
Date
Name
Owned For
Owner Type
Purchase Details
Closed on
Sep 28, 2022
Sold by
Monica Schane
Bought by
Sandoval Martin R and Sandoval Mary E
Current Estimated Value
Purchase Details
Closed on
Apr 11, 2019
Sold by
Sandoval Mary E
Bought by
The Sandoval Investment Trust
Purchase Details
Closed on
Jul 31, 2005
Sold by
Backus Shawn and Backus Tiffani
Bought by
Sandoval Mary E
Purchase Details
Closed on
Dec 5, 2001
Sold by
Mark Highley Construction Inc
Bought by
Backus Shawn and Backus Tiffani
Purchase Details
Closed on
Apr 24, 2001
Sold by
Child Estates Llc
Bought by
Mark Higley Construction Lc
Home Financials for this Owner
Home Financials are based on the most recent Mortgage that was taken out on this home.
Original Mortgage
$117,600
Interest Rate
6.98%
Mortgage Type
Construction
Create a Home Valuation Report for This Property
The Home Valuation Report is an in-depth analysis detailing your home's value as well as a comparison with similar homes in the area
Home Values in the Area
Average Home Value in this Area
Purchase History
| Date | Buyer | Sale Price | Title Company |
|---|---|---|---|
| Sandoval Martin R | -- | -- | |
| The Sandoval Investment Trust | -- | None Available | |
| Sandoval Mary E | -- | Heritage West Title Ins Agen | |
| Backus Shawn | -- | Heritage West Title Insuranc | |
| Mark Higley Construction Lc | -- | Heritage West Title Insuranc | |
| Child Estates Llc | -- | Heritage West Title Insuranc |
Source: Public Records
Mortgage History
| Date | Status | Borrower | Loan Amount |
|---|---|---|---|
| Previous Owner | Child Estates Llc | $117,600 |
Source: Public Records
Tax History Compared to Growth
Tax History
| Year | Tax Paid | Tax Assessment Tax Assessment Total Assessment is a certain percentage of the fair market value that is determined by local assessors to be the total taxable value of land and additions on the property. | Land | Improvement |
|---|---|---|---|---|
| 2025 | $646 | $286,000 | $116,271 | $169,729 |
| 2024 | $624 | $277,201 | $125,395 | $151,806 |
| 2023 | $585 | $482,000 | $146,916 | $335,084 |
| 2022 | $653 | $282,700 | $84,748 | $197,952 |
| 2021 | $667 | $376,000 | $114,845 | $261,155 |
| 2020 | $2,341 | $340,000 | $102,526 | $237,474 |
| 2019 | $2,269 | $322,000 | $110,780 | $211,220 |
| 2018 | $2,159 | $301,000 | $92,444 | $208,556 |
| 2016 | $229 | $140,855 | $36,980 | $103,875 |
| 2015 | $1,925 | $131,725 | $36,980 | $94,745 |
| 2014 | $408 | $131,000 | $36,980 | $94,020 |
| 2013 | -- | $112,662 | $29,450 | $83,212 |
Source: Public Records
Map
Nearby Homes