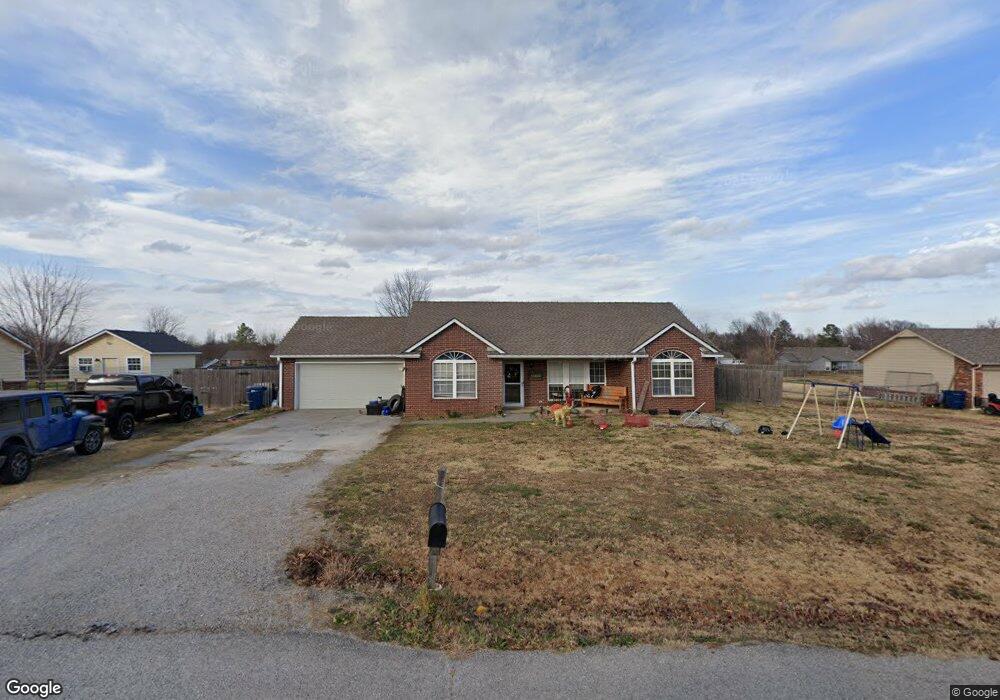
14883 E Modoc St Claremore, OK 74017
Estimated Value: $239,000 - $273,000
3
Beds
2
Baths
1,450
Sq Ft
$176/Sq Ft
Est. Value
About This Home
This home is located at 14883 E Modoc St, Claremore, OK 74017 and is currently estimated at $255,633, approximately $176 per square foot. 14883 E Modoc St is a home located in Rogers County with nearby schools including Justus-Tiawah Public School, Claremore Christian School, and Heritage Adventist School.
Ownership History
Date
Name
Owned For
Owner Type
Purchase Details
Closed on
Nov 9, 2018
Sold by
Home One Eighty Llc
Bought by
Smith Benjamin E and Smith Samantha J
Current Estimated Value
Home Financials for this Owner
Home Financials are based on the most recent Mortgage that was taken out on this home.
Original Mortgage
$150,808
Outstanding Balance
$132,070
Interest Rate
4.7%
Mortgage Type
FHA
Estimated Equity
$123,563
Purchase Details
Closed on
Dec 27, 2017
Sold by
Forbes Jennifer L
Bought by
Home One Eighty Llc
Home Financials for this Owner
Home Financials are based on the most recent Mortgage that was taken out on this home.
Original Mortgage
$110,000
Interest Rate
3.92%
Mortgage Type
Balloon
Purchase Details
Closed on
Jul 29, 2004
Sold by
Quality Home Builders Llc
Bought by
Forbes Jennifer L
Purchase Details
Closed on
Apr 25, 2003
Sold by
Knapp Brett D Properties~Llc
Create a Home Valuation Report for This Property
The Home Valuation Report is an in-depth analysis detailing your home's value as well as a comparison with similar homes in the area
Purchase History
| Date | Buyer | Sale Price | Title Company |
|---|---|---|---|
| Smith Benjamin E | $152,000 | Allegiance T&E Llc | |
| Home One Eighty Llc | $97,000 | Allegance Title & Escrow Llc | |
| Forbes Jennifer L | $116,000 | -- | |
| -- | $15,000 | -- |
Source: Public Records
Mortgage History
| Date | Status | Borrower | Loan Amount |
|---|---|---|---|
| Open | Smith Benjamin E | $150,808 | |
| Previous Owner | Home One Eighty Llc | $110,000 |
Source: Public Records
Tax History
| Year | Tax Paid | Tax Assessment Tax Assessment Total Assessment is a certain percentage of the fair market value that is determined by local assessors to be the total taxable value of land and additions on the property. | Land | Improvement |
|---|---|---|---|---|
| 2025 | $1,841 | $22,170 | $5,220 | $16,950 |
| 2024 | $1,762 | $21,114 | $4,155 | $16,959 |
| 2023 | $1,762 | $20,109 | $3,520 | $16,589 |
| 2022 | $1,593 | $19,151 | $3,520 | $15,631 |
| 2021 | $1,547 | $18,239 | $3,520 | $14,719 |
| 2020 | $1,477 | $17,963 | $3,520 | $14,443 |
| 2019 | $1,439 | $16,616 | $2,860 | $13,756 |
| 2018 | $1,354 | $15,617 | $2,640 | $12,977 |
| 2017 | $1,182 | $15,493 | $2,640 | $12,853 |
| 2016 | $1,207 | $15,149 | $2,860 | $12,289 |
| 2015 | $1,176 | $14,707 | $2,860 | $11,847 |
| 2014 | $1,140 | $14,279 | $2,860 | $11,419 |
Source: Public Records
Map
Nearby Homes
- 20656 S 4180 Rd
- 19985 S Wind Ridge Dr
- 20964 S 4183 Rd
- 9251 E 470 Rd
- 15319 E 470 Rd
- 9501 S 4170 Rd
- 1007 N Faulkner Place
- 18723 S 4185 Rd Unit A
- 2850 Park St
- 18870 Timberlake
- 15232 E 495 Rd
- 1805 NE Oakridge Dr
- 0 S 4190 Rd Unit 2604831
- 0 S 4190 Rd Unit 2600435
- 18810 Timberlake Dr
- 814 E Comet St
- 1137 N Oklahoma Ave
- 1925 Bristol Rd
- 1929 Lexington Rd
- 21481 S 4190 Rd
- 14833 E Modoc St
- 14813 E Modoc St
- 14853 E Modoc St
- 14793 E Modoc St
- 14832 E Modoc St
- 14812 E Modoc St
- 14852 E Modoc St
- 14850 E Shasta St
- 14792 E Modoc St
- 14873 E Modoc St
- 14790 E Shasta St
- 14872 E Modoc St
- 0 E Modoc St
- 14870 E Shasta St
- 14837 E Mccloud St
- 20082 S Klamath
- 14817 E Mccloud St
- 20062 S Klamath
- 14893 E Modoc St
- 14857 E Mccloud St
Your Personal Tour Guide
Ask me questions while you tour the home.