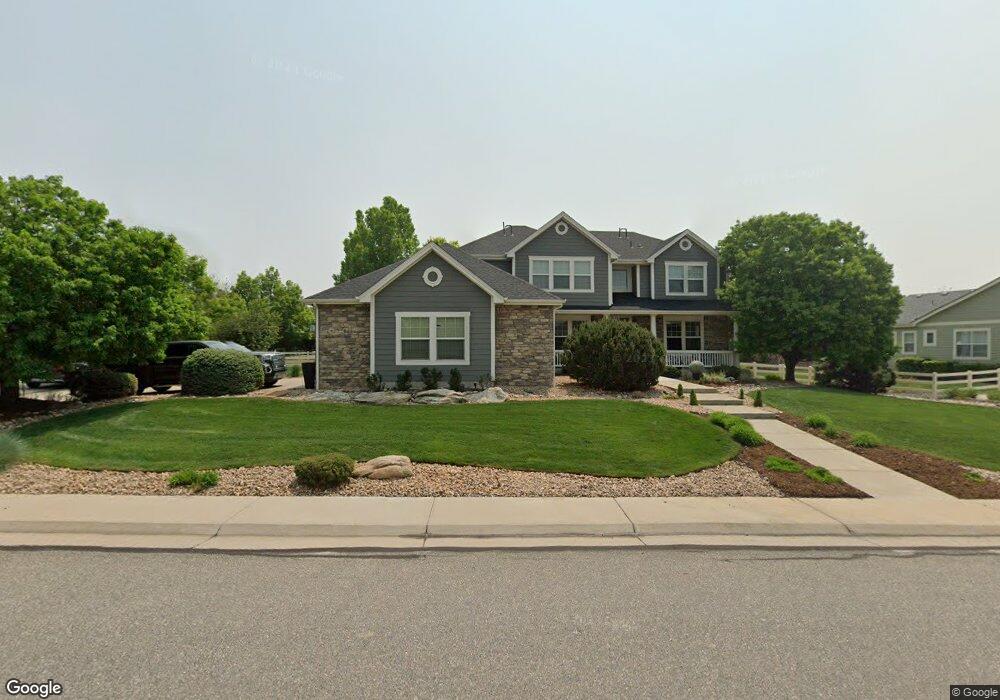
14884 Fillmore Way Thornton, CO 80602
The Haven at York Street NeighborhoodEstimated Value: $876,233 - $975,000
5
Beds
4
Baths
5,020
Sq Ft
$184/Sq Ft
Est. Value
About This Home
This home is located at 14884 Fillmore Way, Thornton, CO 80602 and is currently estimated at $926,058, approximately $184 per square foot. 14884 Fillmore Way is a home located in Adams County with nearby schools including Silver Creek Elementary School, Rocky Top Middle School, and Mountain Range High School.
Ownership History
Date
Name
Owned For
Owner Type
Purchase Details
Closed on
Dec 6, 2019
Sold by
Pollock John Kevin and Pollockt Wendy Kay
Bought by
Clodius Brian and Clodius Leah
Current Estimated Value
Home Financials for this Owner
Home Financials are based on the most recent Mortgage that was taken out on this home.
Original Mortgage
$64,350
Interest Rate
3.7%
Mortgage Type
Credit Line Revolving
Purchase Details
Closed on
Jun 30, 2005
Sold by
Meridian Homes Llc
Bought by
Fryman Lowell W and Fryman Elizabeth A
Home Financials for this Owner
Home Financials are based on the most recent Mortgage that was taken out on this home.
Original Mortgage
$440,000
Interest Rate
7.99%
Mortgage Type
Fannie Mae Freddie Mac
Create a Home Valuation Report for This Property
The Home Valuation Report is an in-depth analysis detailing your home's value as well as a comparison with similar homes in the area
Home Values in the Area
Average Home Value in this Area
Purchase History
| Date | Buyer | Sale Price | Title Company |
|---|---|---|---|
| Clodius Brian | $650,000 | Homestead Title & Escrow | |
| Fryman Lowell W | $550,000 | Land Title Guarantee Company |
Source: Public Records
Mortgage History
| Date | Status | Borrower | Loan Amount |
|---|---|---|---|
| Previous Owner | Clodius Brian | $64,350 | |
| Previous Owner | Fryman Lowell W | $440,000 |
Source: Public Records
Tax History Compared to Growth
Tax History
| Year | Tax Paid | Tax Assessment Tax Assessment Total Assessment is a certain percentage of the fair market value that is determined by local assessors to be the total taxable value of land and additions on the property. | Land | Improvement |
|---|---|---|---|---|
| 2024 | $6,163 | $55,560 | $11,250 | $44,310 |
| 2023 | $6,100 | $63,250 | $11,970 | $51,280 |
| 2022 | $5,000 | $45,390 | $12,300 | $33,090 |
| 2021 | $5,167 | $45,390 | $12,300 | $33,090 |
| 2020 | $5,361 | $48,050 | $12,660 | $35,390 |
| 2019 | $5,371 | $48,050 | $12,660 | $35,390 |
| 2018 | $5,084 | $44,180 | $7,560 | $36,620 |
| 2017 | $4,622 | $44,180 | $7,560 | $36,620 |
| 2016 | $4,012 | $37,330 | $7,880 | $29,450 |
| 2015 | $4,006 | $37,330 | $7,880 | $29,450 |
| 2014 | -- | $35,760 | $7,160 | $28,600 |
Source: Public Records
Map
Nearby Homes
- 2705 E 148th Dr
- 14985 Elizabeth St
- 14725 Gaylord St
- 15004 Vine St
- 15193 St Paul St
- 14747 Race St
- 3122 E 152nd Cir
- 3142 E 152nd Cir
- 3131 E 152nd Cir
- 14558 Vine St
- 14959 Harrison St
- 2028 E 145th Ave
- Vibrant I Plan at Eastcreek Farm - Paired Homes
- Lucent II Plan at Eastcreek Farm - Paired Homes
- Lucent I Plan at Eastcreek Farm - Paired Homes
- Vibrant II Plan at Eastcreek Farm - Paired Homes
- Oliver Plan at Eastcreek Farm - The Camden Collection
- Graham Plan at Eastcreek Farm - The Camden Collection
- Haven Plan at Eastcreek Farm - The Camden Collection
- Hartford Plan at Eastcreek Farm - The Camden Collection
- 14864 Fillmore Way
- 2943 E 148th Place
- 3003 E 148th Place
- 2933 E 148th Place
- 2992 E 148th Place
- 3004 E 148th Place
- 14844 Fillmore Way
- 2982 E 148th Place
- 2923 E 148th Place
- 14855 Fillmore Way
- 3013 E 148th Place
- 2972 E 148th Place
- 2902 E 148th Place
- 14824 Fillmore Way
- 2962 E 148th Place
- 2913 E 148th Place
- 14835 Fillmore Way
- 14915 Fillmore Way
- 14900 Fillmore Way
- 2952 E 148th Place