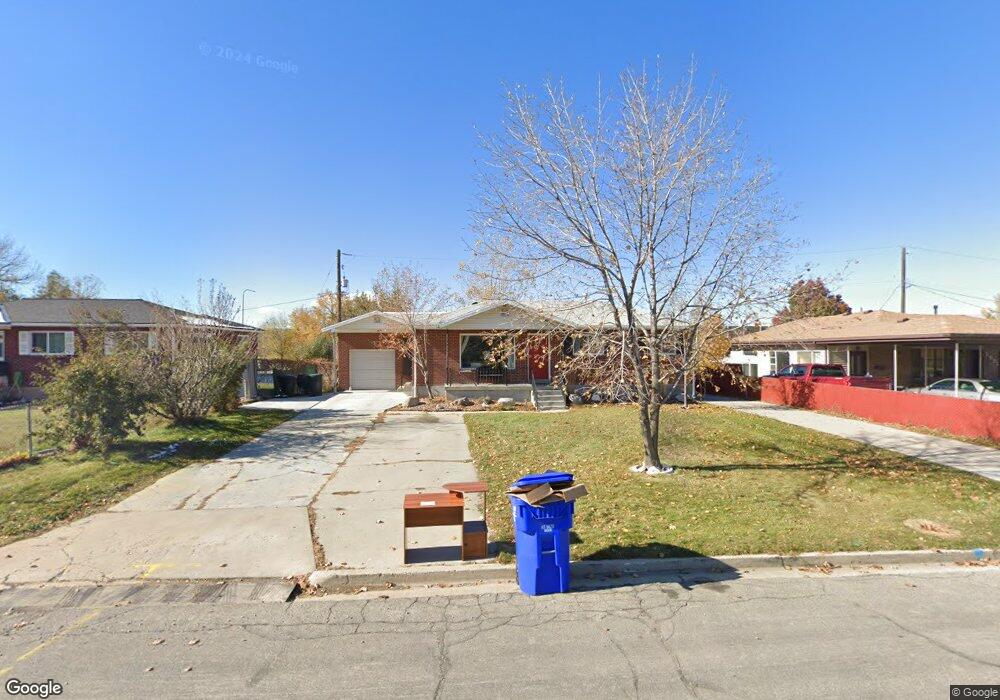
1489 N 400 W Bountiful, UT 84010
Estimated Value: $497,000 - $608,000
About This Home
Property Id: 1637061
PLEASE READ DESCRIPTION BELOW BEFORE INQUIRING
You are renting one of three privately rented rooms w/ kitchen, living/TV (70in) room and bathroom all shared common areas. I screen the tenants to help make sure everyone is a good roommate. Currently, there are two other males in the other two rooms.
Private, newly removed basement room. Shared bathroom in hallway. Full kitchen and wide covered exterior stairs. Basement has 3 private rooms rented.
Add $35 for utilities/internet and $35 for monthly common area cleaning.
Common areas are furnished, bedroom could be semi furnished (bed, dresser)
Don't have actual photo of room, currently someone living in there. Will upload soon
TEXT ME TO SETUP A QUICK CALL TO GET YOUR QUESTIONS ANSWERED Ron
Ownership History
Purchase Details
Purchase Details
Home Financials for this Owner
Home Financials are based on the most recent Mortgage that was taken out on this home.Purchase History
| Date | Buyer | Sale Price | Title Company |
|---|---|---|---|
| Shalvis Ronald W | -- | Backman Title | |
| Shalvis Ronald W | -- | Surety Title Agency |
Mortgage History
| Date | Status | Borrower | Loan Amount |
|---|---|---|---|
| Open | Shalvis Ronald W | $196,860 |
Property History
| Date | Event | Price | List to Sale | Price per Sq Ft |
|---|---|---|---|---|
| 02/10/2025 02/10/25 | Off Market | -- | -- | -- |
| 02/04/2025 02/04/25 | For Rent | -- | -- | -- |
Tax History
| Year | Tax Paid | Tax Assessment Tax Assessment Total Assessment is a certain percentage of the fair market value that is determined by local assessors to be the total taxable value of land and additions on the property. | Land | Improvement |
|---|---|---|---|---|
| 2025 | $3,130 | $288,200 | $122,184 | $166,016 |
| 2024 | $2,906 | $277,200 | $106,323 | $170,877 |
| 2023 | $2,848 | $493,000 | $198,290 | $294,710 |
| 2022 | $2,781 | $263,451 | $109,005 | $154,446 |
| 2021 | $2,515 | $364,000 | $142,542 | $221,458 |
| 2020 | $2,008 | $310,000 | $122,650 | $187,350 |
| 2019 | $2,162 | $326,000 | $135,726 | $190,274 |
| 2018 | $1,865 | $278,000 | $133,189 | $144,811 |
| 2016 | $1,564 | $126,247 | $53,407 | $72,840 |
| 2015 | $1,708 | $130,405 | $53,407 | $76,998 |
| 2014 | $1,511 | $117,930 | $53,407 | $64,523 |
| 2013 | -- | $113,593 | $36,190 | $77,403 |
Map
- 1625 Pages Place
- 1520 N 550 W
- 328 W Pages Ln
- 235 W 1400 N
- 204 Lyman Ln
- 1260 N 200 W
- 366 W 1000 N
- 1767 N 600 W
- 1130 N 200 W
- 951 Centerville Commons Way
- 96 Village Square Rd
- 184 Park Shadows Cir
- 1420 N Main St
- 324 S 600 W
- 287 S 680 W Unit 9
- 106 W 700 N
- 563 N 200 W
- 330 W Paradiso Ln
- 825 W 1320 N
- 789 W 1950 N
Ask me questions while you tour the home.