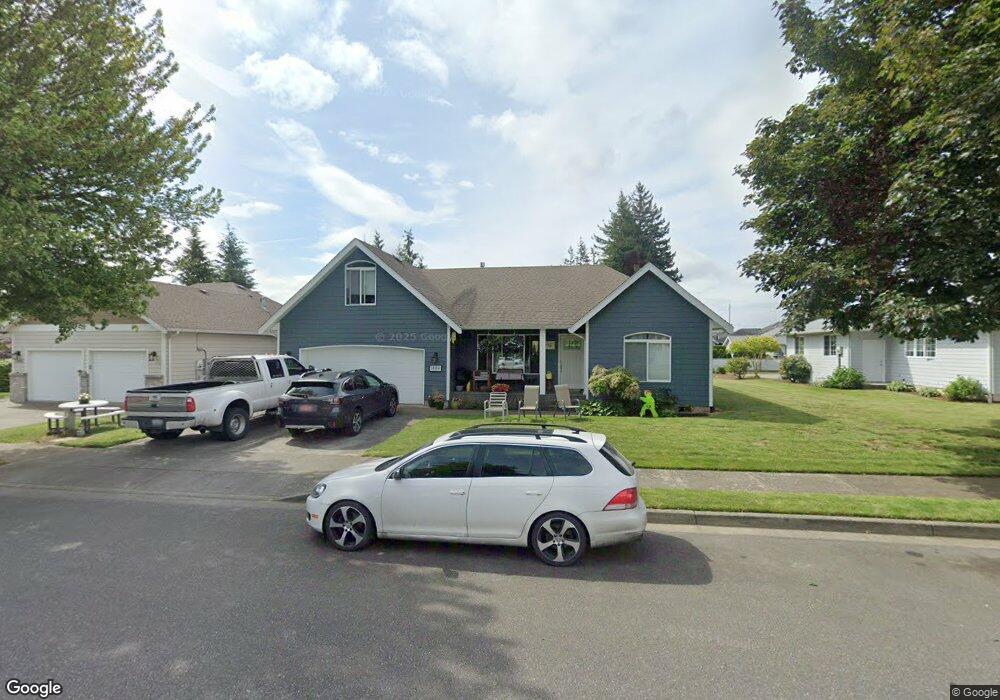
1489 Pine St Lynden, WA 98264
Estimated Value: $585,815 - $611,000
3
Beds
2
Baths
1,644
Sq Ft
$366/Sq Ft
Est. Value
About This Home
This home is located at 1489 Pine St, Lynden, WA 98264 and is currently estimated at $601,454, approximately $365 per square foot. 1489 Pine St is a home located in Whatcom County with nearby schools including Lynden High School, Lynden Christian School, and Lynden Christian Schools: Administration.
Ownership History
Date
Name
Owned For
Owner Type
Purchase Details
Closed on
Nov 10, 2004
Sold by
Ravenhorst Scott I and Ravenhorst Mildred Louise
Bought by
Goodman Terry M and Goodman Julie A
Current Estimated Value
Home Financials for this Owner
Home Financials are based on the most recent Mortgage that was taken out on this home.
Original Mortgage
$182,000
Outstanding Balance
$90,884
Interest Rate
5.79%
Mortgage Type
Purchase Money Mortgage
Estimated Equity
$510,570
Purchase Details
Closed on
Jul 3, 2002
Sold by
Group Four Lynden Llc
Bought by
Vander Velden Construction Inc
Purchase Details
Closed on
Nov 1, 2001
Sold by
Vander Velden Construction Inc
Bought by
Ravenhorst Scott I and Ravenhorst Mildred Louise
Purchase Details
Closed on
Jul 20, 2000
Sold by
Group Four Lynden Llc
Bought by
Vander Velden Construction Inc
Home Financials for this Owner
Home Financials are based on the most recent Mortgage that was taken out on this home.
Original Mortgage
$41,685
Interest Rate
9%
Create a Home Valuation Report for This Property
The Home Valuation Report is an in-depth analysis detailing your home's value as well as a comparison with similar homes in the area
Home Values in the Area
Average Home Value in this Area
Purchase History
| Date | Buyer | Sale Price | Title Company |
|---|---|---|---|
| Goodman Terry M | $262,000 | Chicago Title Insurance | |
| Vander Velden Construction Inc | -- | -- | |
| Ravenhorst Scott I | -- | First American Title Insuran | |
| Vander Velden Construction Inc | $43,500 | First American Title Ins |
Source: Public Records
Mortgage History
| Date | Status | Borrower | Loan Amount |
|---|---|---|---|
| Open | Goodman Terry M | $182,000 | |
| Previous Owner | Vander Velden Construction Inc | $41,685 |
Source: Public Records
Tax History Compared to Growth
Tax History
| Year | Tax Paid | Tax Assessment Tax Assessment Total Assessment is a certain percentage of the fair market value that is determined by local assessors to be the total taxable value of land and additions on the property. | Land | Improvement |
|---|---|---|---|---|
| 2024 | $3,861 | $541,544 | $242,500 | $299,044 |
| 2023 | $3,861 | $537,542 | $250,000 | $287,542 |
| 2022 | $3,354 | $440,497 | $127,711 | $312,786 |
| 2021 | $3,289 | $364,043 | $105,545 | $258,498 |
| 2020 | $2,881 | $325,047 | $94,239 | $230,808 |
| 2019 | $2,563 | $298,101 | $86,527 | $211,574 |
| 2018 | $2,801 | $271,873 | $78,823 | $193,050 |
| 2017 | $2,605 | $244,029 | $70,750 | $173,279 |
| 2016 | $2,456 | $241,358 | $66,000 | $175,358 |
| 2015 | $2,177 | $226,329 | $63,480 | $162,849 |
| 2014 | -- | $218,662 | $61,320 | $157,342 |
| 2013 | -- | $217,342 | $60,000 | $157,342 |
Source: Public Records
Map
Nearby Homes
- 1584 Main St
- 515 17th St
- 735 Ivy St
- 410 10th St
- 805 Cedar Dr
- 403 17th St
- 908 Liberty St
- 0 Guide Meridian Unit NWM2369980
- 1809 Pine Cir
- 518 Edson St
- 1218 Front St
- 885 Sunrise Dr
- 915 Front St
- 301 S Park St
- 1510 E St
- 761 Sunrise Dr
- 872 Sunrise Dr
- 106 Fairside Dr Unit D
- 605 N Forest Ct
- 706 Judson St Unit B