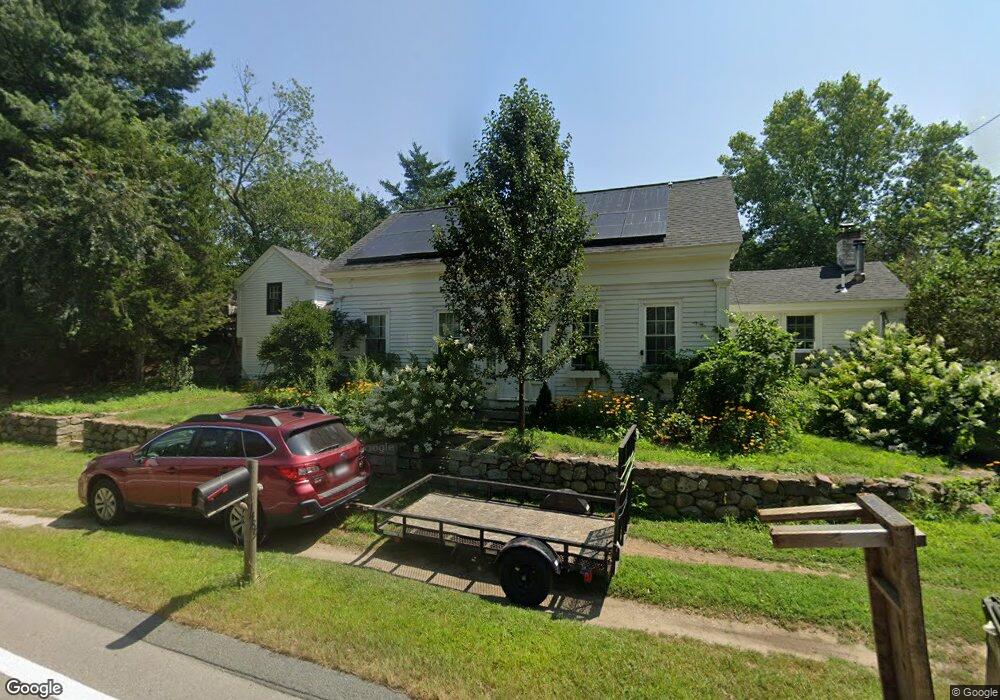
1489 West St Wrentham, MA 02093
West Wrentham NeighborhoodEstimated Value: $662,000 - $832,000
3
Beds
2
Baths
1,944
Sq Ft
$366/Sq Ft
Est. Value
About This Home
This home is located at 1489 West St, Wrentham, MA 02093 and is currently estimated at $711,682, approximately $366 per square foot. 1489 West St is a home located in Norfolk County with nearby schools including Delaney Elementary School, Charles E Roderick, and Mercymount Country Day School.
Ownership History
Date
Name
Owned For
Owner Type
Purchase Details
Closed on
Nov 16, 2000
Sold by
Manning John J
Bought by
Harris Elizabeth A and Quinn Earl J
Current Estimated Value
Purchase Details
Closed on
Oct 27, 1994
Sold by
Bissanti Gloria
Bought by
Manning John J
Create a Home Valuation Report for This Property
The Home Valuation Report is an in-depth analysis detailing your home's value as well as a comparison with similar homes in the area
Home Values in the Area
Average Home Value in this Area
Purchase History
| Date | Buyer | Sale Price | Title Company |
|---|---|---|---|
| Harris Elizabeth A | $400,000 | -- | |
| Manning John J | $155,000 | -- |
Source: Public Records
Mortgage History
| Date | Status | Borrower | Loan Amount |
|---|---|---|---|
| Open | Manning John J | $293,000 | |
| Closed | Manning John J | $50,000 |
Source: Public Records
Tax History Compared to Growth
Tax History
| Year | Tax Paid | Tax Assessment Tax Assessment Total Assessment is a certain percentage of the fair market value that is determined by local assessors to be the total taxable value of land and additions on the property. | Land | Improvement |
|---|---|---|---|---|
| 2025 | $6,217 | $536,400 | $288,500 | $247,900 |
| 2024 | $6,293 | $524,400 | $288,500 | $235,900 |
| 2023 | $5,452 | $432,000 | $262,400 | $169,600 |
| 2022 | $5,982 | $437,600 | $255,600 | $182,000 |
| 2021 | $5,835 | $414,700 | $238,900 | $175,800 |
| 2020 | $5,530 | $388,100 | $182,500 | $205,600 |
| 2019 | $5,223 | $369,900 | $164,300 | $205,600 |
| 2018 | $6,115 | $429,400 | $164,100 | $265,300 |
| 2017 | $5,992 | $420,500 | $160,900 | $259,600 |
| 2016 | $5,868 | $410,900 | $156,300 | $254,600 |
| 2015 | $6,010 | $401,200 | $166,900 | $234,300 |
| 2014 | $5,953 | $388,800 | $160,500 | $228,300 |
Source: Public Records
Map
Nearby Homes
- 50 Heather Ln
- 39 Sumner Brown Rd
- 236 Williams St
- 60 Grant Ave
- 2095 West St
- 11 Amber Dr
- 4 Evans St
- 955 Summer St
- 80 Carriage House Ln
- 50 Green St
- 180 Pine Swamp Rd
- 56 Pine Swamp Rd
- 17 Stanford Rd
- 440 Chestnut St
- 19 Chestnut Lot 0
- 300 Tower Hill Rd
- 4022 Diamond Hill Rd
- 10 Stanford Rd
- 584 Washington St
- 25 Nature View Dr