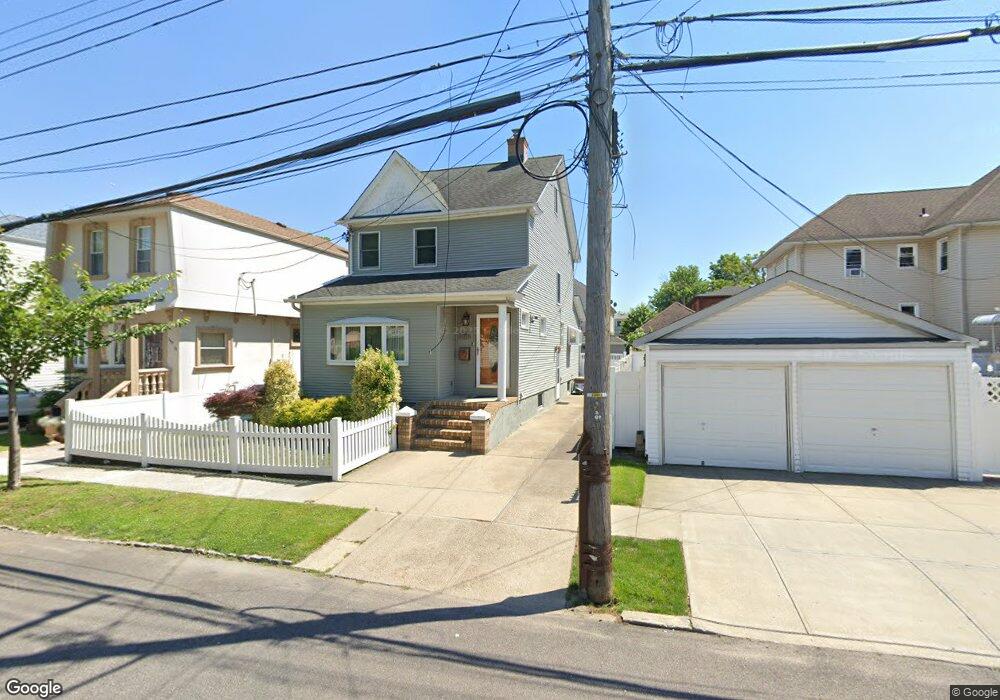
149-12 17 Rd Whitestone, NY 11357
Whitestone NeighborhoodEstimated Value: $1,036,000 - $1,240,000
3
Beds
3
Baths
1,445
Sq Ft
$796/Sq Ft
Est. Value
About This Home
This home is located at 149-12 17 Rd, Whitestone, NY 11357 and is currently estimated at $1,150,464, approximately $796 per square foot. 149-12 17 Rd is a home located in Queens County with nearby schools including J.H.S. 194 William Carr, Flushing High School, and Holy Trinity School.
Ownership History
Date
Name
Owned For
Owner Type
Purchase Details
Closed on
Mar 18, 2021
Sold by
Zhuo Wen Hang and Zhuo Wen Xiu
Bought by
Ouyang Hui Yu and Zhuo Wen Hang
Current Estimated Value
Purchase Details
Closed on
Feb 6, 2017
Sold by
Lu Cai Ping Suen
Bought by
Zhuo Wen Hang and Zhuo Wen Xiu
Home Financials for this Owner
Home Financials are based on the most recent Mortgage that was taken out on this home.
Original Mortgage
$450,000
Outstanding Balance
$371,744
Interest Rate
4.12%
Mortgage Type
Purchase Money Mortgage
Estimated Equity
$778,720
Purchase Details
Closed on
Aug 20, 2014
Sold by
Reilly Julianne and Reilly Paul
Bought by
Lu Cai Ping Suen
Purchase Details
Closed on
Nov 4, 2002
Sold by
Pitonzo Josephg and Pitonzo Jeanette
Bought by
Reilly Paul and Reilly Julianne
Home Financials for this Owner
Home Financials are based on the most recent Mortgage that was taken out on this home.
Original Mortgage
$260,000
Interest Rate
6.16%
Create a Home Valuation Report for This Property
The Home Valuation Report is an in-depth analysis detailing your home's value as well as a comparison with similar homes in the area
Home Values in the Area
Average Home Value in this Area
Purchase History
| Date | Buyer | Sale Price | Title Company |
|---|---|---|---|
| Ouyang Hui Yu | -- | -- | |
| Zhuo Wen Hang | $890,000 | -- | |
| Lu Cai Ping Suen | $772,000 | -- | |
| Reilly Paul | -- | -- |
Source: Public Records
Mortgage History
| Date | Status | Borrower | Loan Amount |
|---|---|---|---|
| Open | Zhuo Wen Hang | $450,000 | |
| Previous Owner | Reilly Paul | $260,000 |
Source: Public Records
Tax History Compared to Growth
Tax History
| Year | Tax Paid | Tax Assessment Tax Assessment Total Assessment is a certain percentage of the fair market value that is determined by local assessors to be the total taxable value of land and additions on the property. | Land | Improvement |
|---|---|---|---|---|
| 2025 | $7,858 | $40,238 | $7,886 | $32,352 |
| 2024 | $7,858 | $39,122 | $8,677 | $30,445 |
| 2023 | $7,426 | $36,974 | $9,022 | $27,952 |
| 2022 | $7,038 | $60,420 | $14,040 | $46,380 |
| 2021 | $7,057 | $59,820 | $14,040 | $45,780 |
| 2020 | $7,098 | $54,000 | $14,040 | $39,960 |
| 2019 | $6,820 | $54,120 | $14,040 | $40,080 |
| 2018 | $6,281 | $30,812 | $8,452 | $22,360 |
| 2017 | $5,989 | $29,378 | $8,012 | $21,366 |
| 2016 | $5,586 | $29,378 | $8,012 | $21,366 |
| 2015 | $3,161 | $27,943 | $9,993 | $17,950 |
| 2014 | $3,161 | $27,169 | $11,657 | $15,512 |
Source: Public Records
Map
Nearby Homes
- 149-11 19th Ave
- 16-12 149th St
- 147-20 17th Ave
- 19-05 147th St
- 149-56 20th Ave
- 147-16 20th Ave
- 1535 149th St
- 1527 149th St
- 150-29 16th Rd
- 14915 15th Rd
- 17 Murray St Unit 4FL
- 20-39 150th St
- 15050 15th Dr
- 2005 Murray St
- 151-26 20th Ave
- 22-01 149th St
- 15-59 150th Place
- 151-35 20th Rd
- 151-25 21st Ave
- 20-21 Parsons Blvd
- 14906 17th Rd
- 1735 149th St
- 149-12 17th Rd Unit 1 Fl
- 149-12 17th Rd
- 14912 17th Rd
- 149-22 17th Rd
- 149-22 17th Rd Unit 1st fl
- 149-22 17th Rd Unit 1 Fl
- 149-22 17th Rd Unit 2 Fl
- 1737 149th St
- 14916 17th Rd
- 1739 149th St
- 17-39 149th St Unit 1st fl
- 17-39 149th St
- 1739 149th St
- 1717 149th St
- 14920 17th Rd
- 14909 18th Ave
- 1715 149th St
- 14911 17th Rd