149 Camden St Camden, ME 04843
Estimated Value: $421,488 - $598,000
2
Beds
1
Bath
1,285
Sq Ft
$385/Sq Ft
Est. Value
About This Home
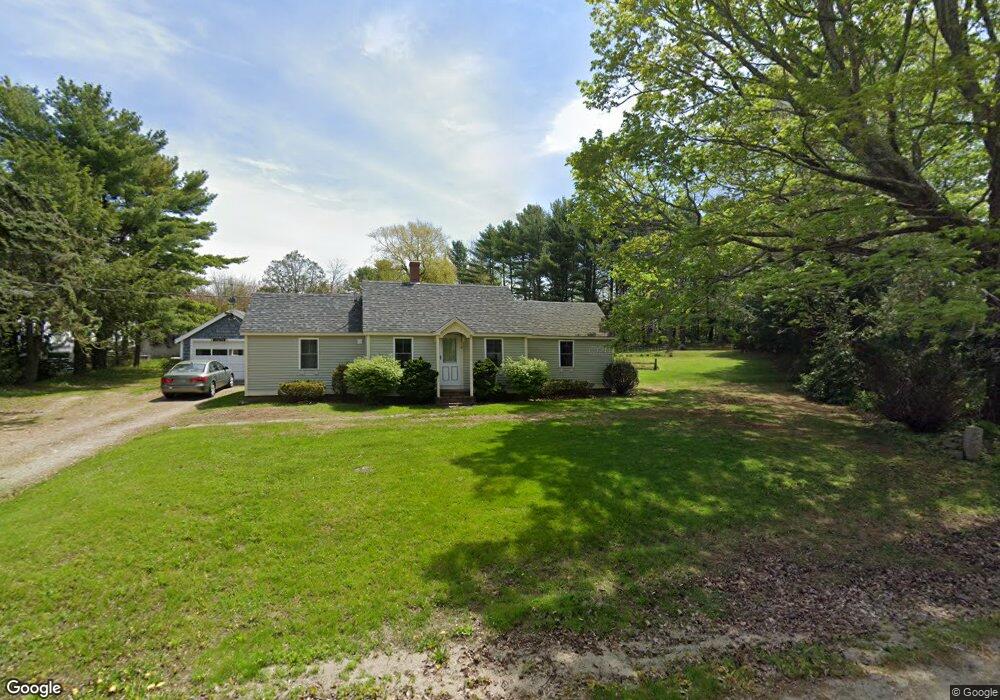
This home is located at 149 Camden St, Camden, ME 04843 and is currently estimated at $495,122, approximately $385 per square foot. 149 Camden St is a home located in Knox County with nearby schools including Camden-Rockport Elementary School, Camden-Rockport Middle School, and Camden Hills Regional High School.
Ownership History
Date
Name
Owned For
Owner Type
Purchase Details
Closed on
Jun 10, 2024
Sold by
Chater Helen M Est and Goodwin
Bought by
E E Dyer Llc
Current Estimated Value
Home Financials for this Owner
Home Financials are based on the most recent Mortgage that was taken out on this home.
Original Mortgage
$271,600
Outstanding Balance
$267,760
Interest Rate
7.17%
Mortgage Type
Purchase Money Mortgage
Estimated Equity
$227,362
Create a Home Valuation Report for This Property
The Home Valuation Report is an in-depth analysis detailing your home's value as well as a comparison with similar homes in the area
Home Values in the Area
Average Home Value in this Area
Purchase History
| Date | Buyer | Sale Price | Title Company |
|---|---|---|---|
| E E Dyer Llc | $325,000 | None Available | |
| E E Dyer Llc | $325,000 | None Available | |
| E E Dyer Llc | $325,000 | None Available | |
| E E Dyer Llc | $325,000 | None Available |
Source: Public Records
Mortgage History
| Date | Status | Borrower | Loan Amount |
|---|---|---|---|
| Open | E E Dyer Llc | $271,600 | |
| Closed | E E Dyer Llc | $271,600 |
Source: Public Records
Tax History Compared to Growth
Tax History
| Year | Tax Paid | Tax Assessment Tax Assessment Total Assessment is a certain percentage of the fair market value that is determined by local assessors to be the total taxable value of land and additions on the property. | Land | Improvement |
|---|---|---|---|---|
| 2024 | $3,881 | $369,600 | $160,000 | $209,600 |
| 2023 | $4,348 | $315,100 | $75,000 | $240,100 |
| 2022 | $4,159 | $315,100 | $75,000 | $240,100 |
| 2021 | $4,194 | $273,200 | $80,600 | $192,600 |
| 2020 | $4,106 | $273,200 | $80,600 | $192,600 |
| 2019 | $4,073 | $273,200 | $80,600 | $192,600 |
| 2018 | $3,634 | $244,200 | $75,900 | $168,300 |
| 2017 | $3,512 | $244,200 | $75,900 | $168,300 |
| 2016 | $3,177 | $203,800 | $74,200 | $129,600 |
| 2015 | $3,083 | $203,800 | $74,200 | $129,600 |
| 2014 | $2,941 | $203,800 | $74,200 | $129,600 |
| 2013 | $2,861 | $203,800 | $74,200 | $129,600 |
Source: Public Records
Map
Nearby Homes