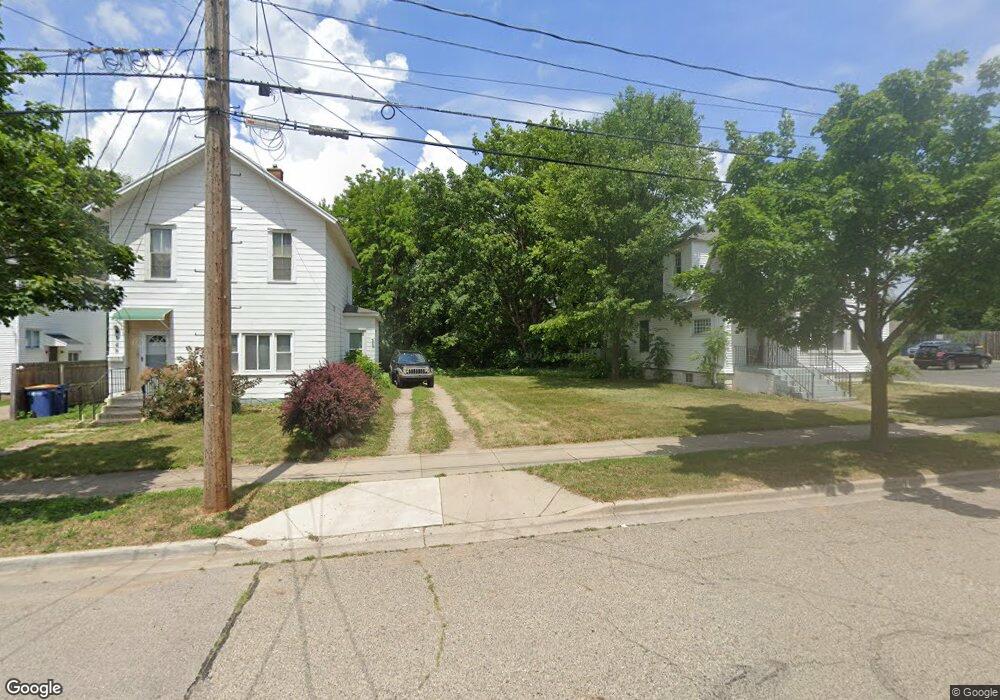
149 Carrier St NE Grand Rapids, MI 49505
Creston NeighborhoodEstimated Value: $36,000 - $284,000
3
Beds
2
Baths
1
Sq Ft
$191,433/Sq Ft
Est. Value
About This Home
This home is located at 149 Carrier St NE, Grand Rapids, MI 49505 and is currently estimated at $191,433, approximately $191,433 per square foot. 149 Carrier St NE is a home located in Kent County with nearby schools including Palmer School, Riverside Middle School, and Union High School.
Ownership History
Date
Name
Owned For
Owner Type
Purchase Details
Closed on
Sep 27, 2013
Sold by
Kent County Land Bank Authority
Bought by
Walkowiak David J
Current Estimated Value
Purchase Details
Closed on
Dec 4, 2012
Sold by
Hsbc Bank Usa
Bought by
Kent County Land Bank Authority
Purchase Details
Closed on
Nov 2, 2011
Sold by
Vandermolen Timothy S and Vandermolen Shirley L
Bought by
Hsbc Bank Usa
Purchase Details
Closed on
Feb 7, 1995
Sold by
Seibert Seibert M M and Seibert Vandermole
Bought by
Diocese Vandermole and Diocese Of Grand Rapids
Purchase Details
Closed on
Feb 22, 1994
Purchase Details
Closed on
Nov 7, 1993
Bought by
Diocese Of Grand Rapids
Purchase Details
Closed on
Nov 6, 1993
Sold by
Skonieczny Skonieczny J J and Skonieczny Mishda
Bought by
Diocese Of Grand Rapids
Purchase Details
Closed on
May 6, 1993
Bought by
Diocese Of Grand Rapids
Purchase Details
Closed on
Jun 8, 1990
Sold by
Doyle Doyle S S and Skonieczny Doyle
Bought by
Diocese Of Grand Rapids
Create a Home Valuation Report for This Property
The Home Valuation Report is an in-depth analysis detailing your home's value as well as a comparison with similar homes in the area
Home Values in the Area
Average Home Value in this Area
Purchase History
| Date | Buyer | Sale Price | Title Company |
|---|---|---|---|
| Walkowiak David J | -- | Sun Title Agency Of Michigan | |
| Kent County Land Bank Authority | -- | None Available | |
| Hsbc Bank Usa | $19,000 | None Available | |
| Diocese Vandermole | $42,000 | -- | |
| -- | $23,300 | -- | |
| Diocese Of Grand Rapids | -- | -- | |
| Diocese Of Grand Rapids | -- | -- | |
| Diocese Of Grand Rapids | $43,000 | -- | |
| Diocese Of Grand Rapids | $37,900 | -- |
Source: Public Records
Tax History Compared to Growth
Tax History
| Year | Tax Paid | Tax Assessment Tax Assessment Total Assessment is a certain percentage of the fair market value that is determined by local assessors to be the total taxable value of land and additions on the property. | Land | Improvement |
|---|---|---|---|---|
| 2025 | $307 | $17,900 | $0 | $0 |
| 2024 | $307 | $12,800 | $0 | $0 |
| 2023 | $293 | $8,500 | $0 | $0 |
| 2022 | $289 | $7,400 | $0 | $0 |
| 2021 | $282 | $6,700 | $0 | $0 |
| 2020 | $272 | $6,100 | $0 | $0 |
| 2019 | $279 | $5,600 | $0 | $0 |
| 2018 | $270 | $5,600 | $0 | $0 |
| 2017 | $264 | $5,000 | $0 | $0 |
| 2016 | $267 | $5,000 | $0 | $0 |
| 2015 | $256 | $5,000 | $0 | $0 |
| 2013 | -- | $0 | $0 | $0 |
Source: Public Records
Map
Nearby Homes
- 117 Leonard St NE
- 57 Leonard St NE
- 64 Quimby St NE
- 255 Barnett St NE
- 1420 Buffalo Ave NE
- 327 Carrier St NE
- 330 Page St NE
- 350 Page St NE
- 24 Mathews Ct NE
- 1530 Queen Ave NE
- 327 Quimby St NE
- 212 Saunders Ct NE
- 1402 North Ave NE
- 1032 Lafayette Ave NE
- 1501 North Ave NE
- 310 Sweet St NE
- 443 Quimby St NE
- 943 Prospect Ave NE
- 918 Lafayette Ave NE
- 1516 Cole Ave NE
- 153 Carrier St NE
- 145 Carrier St NE
- 141 Carrier St NE
- 137 Carrier St NE
- 132 Page St NE
- 136 Page St NE
- 130 Page St NE
- 131 Carrier St NE
- 142 Page St NE
- 146 Carrier St NE
- 154 Carrier St NE
- 144 Page St NE
- 120 Page St NE
- 156 Carrier St NE
- 142 Carrier St NE
- 148 Page St NE
- 160 Carrier St NE
- 160 Carrier St NE Unit 1
- 138 Carrier St NE
- 125 Carrier St NE