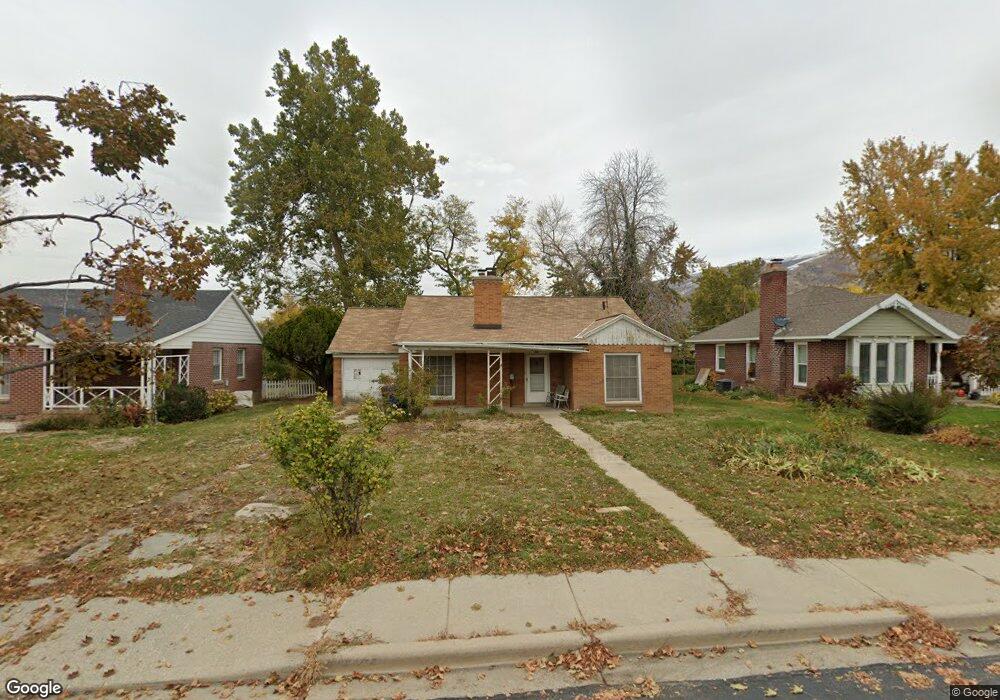
149 E 650 N Bountiful, UT 84010
Estimated Value: $566,000 - $634,000
4
Beds
3
Baths
2,542
Sq Ft
$240/Sq Ft
Est. Value
About This Home
This home is located at 149 E 650 N, Bountiful, UT 84010 and is currently estimated at $609,319, approximately $239 per square foot. 149 E 650 N is a home located in Davis County with nearby schools including Tolman School, Bountiful Junior High School, and Viewmont High School.
Ownership History
Date
Name
Owned For
Owner Type
Purchase Details
Closed on
May 21, 2024
Sold by
Tvm Llc
Bought by
Anderson Zachary Rolfe and Kim Tessa Taylor
Current Estimated Value
Home Financials for this Owner
Home Financials are based on the most recent Mortgage that was taken out on this home.
Original Mortgage
$395,000
Outstanding Balance
$387,916
Interest Rate
6.82%
Mortgage Type
New Conventional
Estimated Equity
$221,403
Purchase Details
Closed on
May 18, 2023
Sold by
Neeley George Raymond
Bought by
Tvm Llc
Purchase Details
Closed on
Apr 1, 1998
Sold by
Warren Norman S and Warren Jeanette N
Bought by
Neeley George Raymond
Create a Home Valuation Report for This Property
The Home Valuation Report is an in-depth analysis detailing your home's value as well as a comparison with similar homes in the area
Purchase History
| Date | Buyer | Sale Price | Title Company |
|---|---|---|---|
| Anderson Zachary Rolfe | -- | Highland Title | |
| Tvm Llc | -- | Highland Title | |
| Neeley George Raymond | -- | -- |
Source: Public Records
Mortgage History
| Date | Status | Borrower | Loan Amount |
|---|---|---|---|
| Open | Anderson Zachary Rolfe | $395,000 |
Source: Public Records
Tax History
| Year | Tax Paid | Tax Assessment Tax Assessment Total Assessment is a certain percentage of the fair market value that is determined by local assessors to be the total taxable value of land and additions on the property. | Land | Improvement |
|---|---|---|---|---|
| 2025 | $3,544 | $325,600 | $133,271 | $192,329 |
| 2024 | $2,743 | $257,399 | $119,369 | $138,030 |
| 2023 | $2,604 | $443,000 | $219,381 | $223,619 |
| 2022 | $402 | $246,950 | $119,732 | $127,218 |
| 2021 | $273 | $312,000 | $156,706 | $155,294 |
| 2020 | $204 | $276,000 | $133,663 | $142,337 |
| 2019 | $209 | $265,000 | $139,807 | $125,193 |
| 2018 | $179 | $241,000 | $137,192 | $103,808 |
| 2016 | $158 | $125,125 | $57,424 | $67,701 |
| 2015 | $1,698 | $119,185 | $57,424 | $61,761 |
| 2014 | $125 | $113,746 | $57,424 | $56,322 |
| 2013 | -- | $96,260 | $43,945 | $52,315 |
Source: Public Records
Map
Nearby Homes
- 978 N 170 E
- 17 E 400 N Unit 19B
- 453 N 400 E Unit 7-D
- 513 N 400 E Unit 14B
- 106 W 700 N
- 214 E 1250 N
- 49 E 200 N Unit 4
- 41 E 200 N Unit 6
- 252 N Main St
- 256 N Main St
- 254 N Main St
- 55 E 200 N Unit 2
- 51 E 200 N Unit 3
- 1420 N Main St
- 1130 N 200 W
- 499 N 200 W Unit 30
- 499 N 200 W Unit 19
- 563 N 200 W
- 320 N 200 W Unit 4
- 1260 N 200 W
Your Personal Tour Guide
Ask me questions while you tour the home.