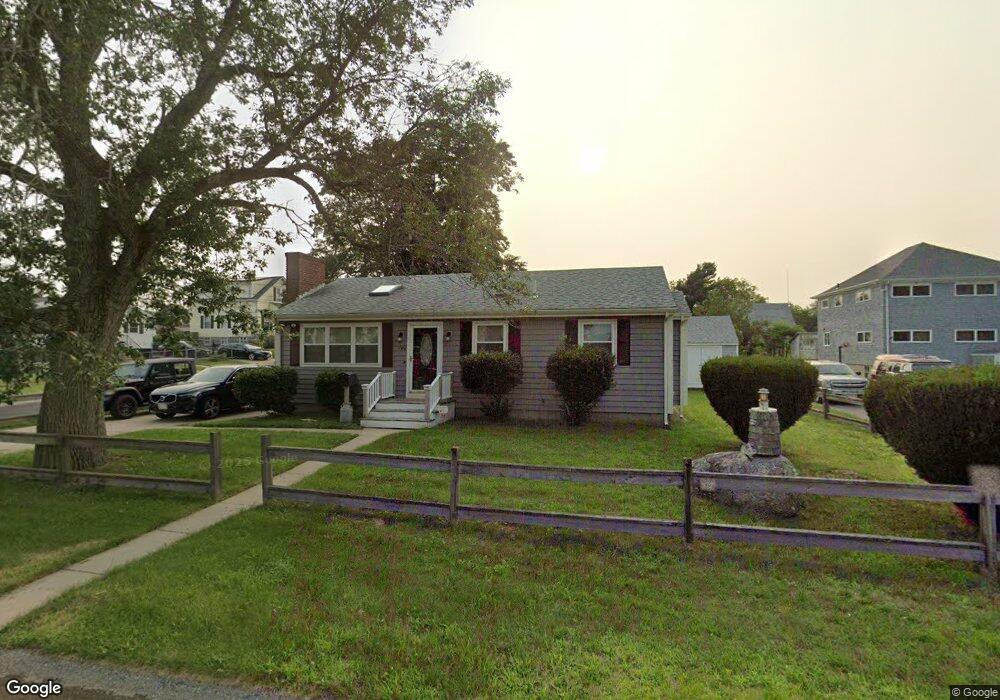
149 Eclipse St Fall River, MA 02724
Father Kelly NeighborhoodEstimated Value: $405,877 - $436,000
3
Beds
1
Bath
1,407
Sq Ft
$298/Sq Ft
Est. Value
About This Home
This home is located at 149 Eclipse St, Fall River, MA 02724 and is currently estimated at $419,719, approximately $298 per square foot. 149 Eclipse St is a home located in Bristol County with nearby schools including Henry Lord Community School, B M C Durfee High School, and Argosy Collegiate Charter School.
Ownership History
Date
Name
Owned For
Owner Type
Purchase Details
Closed on
Sep 1, 2000
Sold by
Dupere Paul E and Dupere Patricia A
Bought by
Dupere Rene R
Current Estimated Value
Home Financials for this Owner
Home Financials are based on the most recent Mortgage that was taken out on this home.
Original Mortgage
$103,000
Outstanding Balance
$37,699
Interest Rate
8.16%
Mortgage Type
Purchase Money Mortgage
Estimated Equity
$382,020
Create a Home Valuation Report for This Property
The Home Valuation Report is an in-depth analysis detailing your home's value as well as a comparison with similar homes in the area
Home Values in the Area
Average Home Value in this Area
Purchase History
| Date | Buyer | Sale Price | Title Company |
|---|---|---|---|
| Dupere Rene R | $130,000 | -- |
Source: Public Records
Mortgage History
| Date | Status | Borrower | Loan Amount |
|---|---|---|---|
| Open | Dupere Rene R | $103,000 | |
| Previous Owner | Dupere Rene R | $60,000 | |
| Previous Owner | Dupere Rene R | $50,000 |
Source: Public Records
Tax History
| Year | Tax Paid | Tax Assessment Tax Assessment Total Assessment is a certain percentage of the fair market value that is determined by local assessors to be the total taxable value of land and additions on the property. | Land | Improvement |
|---|---|---|---|---|
| 2025 | $3,963 | $346,100 | $129,300 | $216,800 |
| 2024 | $3,697 | $321,800 | $124,400 | $197,400 |
| 2023 | $3,482 | $283,800 | $106,600 | $177,200 |
| 2022 | $3,059 | $242,400 | $96,900 | $145,500 |
| 2021 | $4,272 | $212,300 | $89,700 | $122,600 |
| 2020 | $2,837 | $196,300 | $85,800 | $110,500 |
| 2019 | $2,675 | $183,500 | $81,800 | $101,700 |
| 2018 | $2,561 | $175,200 | $80,200 | $95,000 |
| 2017 | $2,456 | $175,400 | $81,900 | $93,500 |
| 2016 | $2,377 | $174,400 | $85,300 | $89,100 |
| 2015 | $2,242 | $171,400 | $82,100 | $89,300 |
| 2014 | $2,210 | $175,700 | $86,400 | $89,300 |
Source: Public Records
Map
Nearby Homes
Your Personal Tour Guide
Ask me questions while you tour the home.