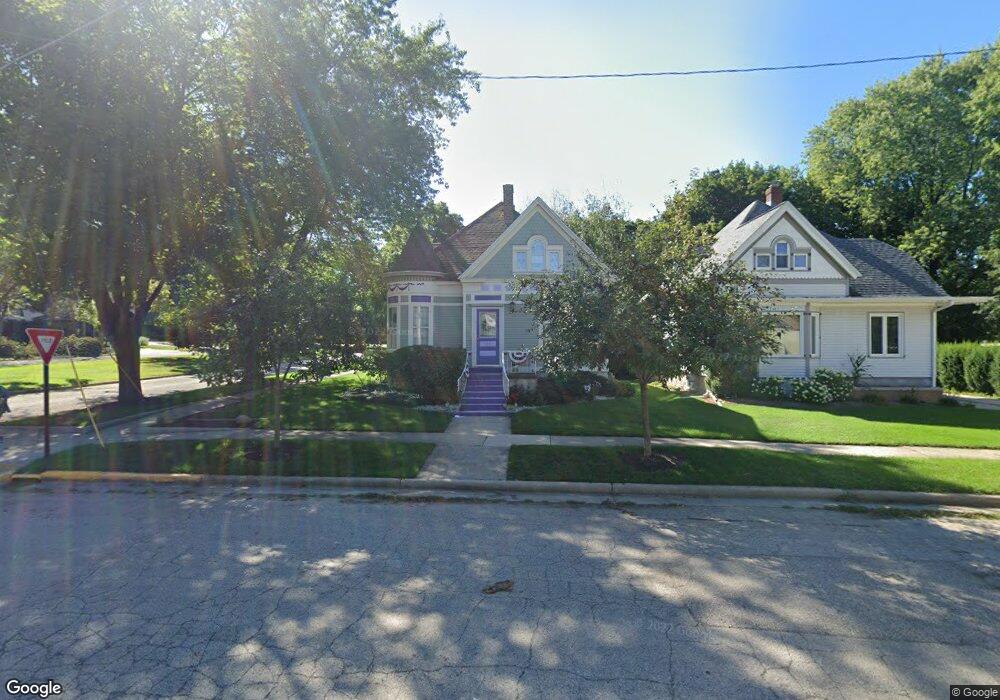
149 Edward St Burlington, WI 53105
Estimated Value: $319,000 - $358,000
4
Beds
1
Bath
1,872
Sq Ft
$179/Sq Ft
Est. Value
About This Home
This home is located at 149 Edward St, Burlington, WI 53105 and is currently estimated at $335,604, approximately $179 per square foot. 149 Edward St is a home located in Racine County with nearby schools including Waller Elementary School, Cooper Montessori School, and Nettie E. Karcher School.
Ownership History
Date
Name
Owned For
Owner Type
Purchase Details
Closed on
Oct 13, 2011
Sold by
Booth Kevin J and Booth Noelle J
Bought by
Fifer Stephen J and Fifer Jean
Current Estimated Value
Home Financials for this Owner
Home Financials are based on the most recent Mortgage that was taken out on this home.
Original Mortgage
$195,500
Outstanding Balance
$133,467
Interest Rate
4.12%
Mortgage Type
Purchase Money Mortgage
Estimated Equity
$202,137
Purchase Details
Closed on
May 25, 2010
Sold by
Brenton Ellen and The Kathryn Fonk Revocable Liv
Bought by
Booth Kevin J and Booth Noelle J
Create a Home Valuation Report for This Property
The Home Valuation Report is an in-depth analysis detailing your home's value as well as a comparison with similar homes in the area
Home Values in the Area
Average Home Value in this Area
Purchase History
| Date | Buyer | Sale Price | Title Company |
|---|---|---|---|
| Fifer Stephen J | $161,000 | None Available | |
| Booth Kevin J | $152,000 | None Available |
Source: Public Records
Mortgage History
| Date | Status | Borrower | Loan Amount |
|---|---|---|---|
| Open | Fifer Stephen J | $195,500 |
Source: Public Records
Tax History Compared to Growth
Tax History
| Year | Tax Paid | Tax Assessment Tax Assessment Total Assessment is a certain percentage of the fair market value that is determined by local assessors to be the total taxable value of land and additions on the property. | Land | Improvement |
|---|---|---|---|---|
| 2024 | $3,929 | $288,900 | $12,900 | $276,000 |
| 2023 | $3,708 | $268,200 | $12,900 | $255,300 |
| 2022 | $3,798 | $234,100 | $12,900 | $221,200 |
| 2021 | $3,648 | $213,800 | $12,900 | $200,900 |
| 2020 | $3,719 | $202,800 | $12,900 | $189,900 |
| 2019 | $3,387 | $180,800 | $12,900 | $167,900 |
| 2018 | $3,374 | $174,700 | $12,900 | $161,800 |
| 2017 | $3,599 | $162,400 | $12,900 | $149,500 |
| 2016 | $3,490 | $152,800 | $12,900 | $139,900 |
| 2015 | $3,385 | $152,800 | $12,900 | $139,900 |
| 2014 | $3,503 | $161,000 | $12,900 | $148,100 |
| 2013 | $3,686 | $161,000 | $12,900 | $148,100 |
Source: Public Records
Map
Nearby Homes