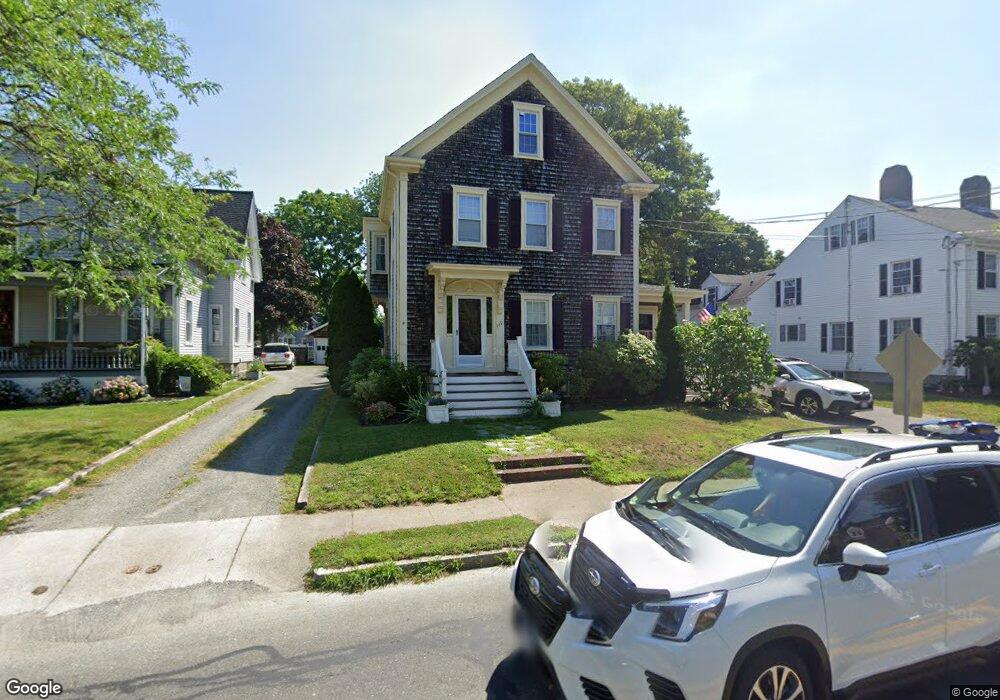
149 Main St Unit 1 Fairhaven, MA 02719
Oxford NeighborhoodEstimated Value: $386,000 - $544,000
2
Beds
2
Baths
1,477
Sq Ft
$294/Sq Ft
Est. Value
About This Home
This home is located at 149 Main St Unit 1, Fairhaven, MA 02719 and is currently estimated at $434,863, approximately $294 per square foot. 149 Main St Unit 1 is a home located in Bristol County with nearby schools including Fairhaven High School, City On A Hill Charter Public School New Bedford, and St. Joseph School.
Ownership History
Date
Name
Owned For
Owner Type
Purchase Details
Closed on
Jul 17, 2006
Sold by
Sweeney Margaret A
Bought by
Sweeney Angela and Sweeney Brian
Current Estimated Value
Home Financials for this Owner
Home Financials are based on the most recent Mortgage that was taken out on this home.
Original Mortgage
$200,000
Outstanding Balance
$119,128
Interest Rate
6.71%
Mortgage Type
Purchase Money Mortgage
Estimated Equity
$315,735
Create a Home Valuation Report for This Property
The Home Valuation Report is an in-depth analysis detailing your home's value as well as a comparison with similar homes in the area
Home Values in the Area
Average Home Value in this Area
Purchase History
| Date | Buyer | Sale Price | Title Company |
|---|---|---|---|
| Sweeney Angela | $250,000 | -- |
Source: Public Records
Mortgage History
| Date | Status | Borrower | Loan Amount |
|---|---|---|---|
| Open | Sweeney Angela | $200,000 |
Source: Public Records
Tax History
| Year | Tax Paid | Tax Assessment Tax Assessment Total Assessment is a certain percentage of the fair market value that is determined by local assessors to be the total taxable value of land and additions on the property. | Land | Improvement |
|---|---|---|---|---|
| 2025 | $32 | $348,500 | $0 | $348,500 |
| 2024 | $3,020 | $327,200 | $0 | $327,200 |
| 2023 | $3,023 | $303,800 | $0 | $303,800 |
| 2022 | $3,105 | $303,800 | $0 | $303,800 |
| 2021 | $3,285 | $291,000 | $0 | $291,000 |
| 2020 | $3,218 | $291,000 | $0 | $291,000 |
| 2019 | $3,396 | $291,000 | $0 | $291,000 |
| 2018 | $3,419 | $291,000 | $0 | $291,000 |
| 2017 | $2,826 | $234,700 | $0 | $234,700 |
| 2016 | $2,859 | $234,700 | $0 | $234,700 |
| 2015 | $2,852 | $234,700 | $0 | $234,700 |
Source: Public Records
Map
Nearby Homes
- 138 Main St Unit 13
- 61 Oxford St
- 67 Bridge St
- 78 Middle St
- 15 School St
- 39 Christian St
- 48 Bellevue St
- 0 Nulands Neck Unit 73286360
- 8 Washington St
- 77 Adams St
- 58 Washington St
- 145 Pleasant St
- 132 Pleasant St
- 24 Middle St
- 442 Dana Farms
- 313 Main St
- 14 Sycamore St
- 253 Adams St
- 70 Chestnut St
- 181 Washington St
Your Personal Tour Guide
Ask me questions while you tour the home.