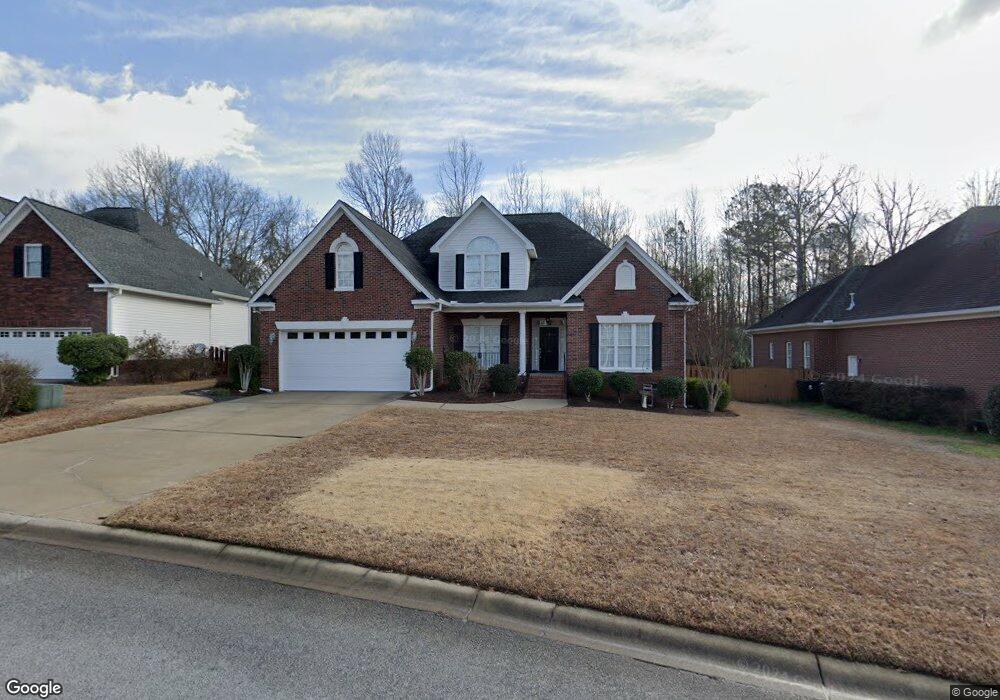
149 Mariners Creek Dr Lexington, SC 29072
Estimated Value: $432,000 - $497,000
4
Beds
3
Baths
2,690
Sq Ft
$173/Sq Ft
Est. Value
About This Home
This home is located at 149 Mariners Creek Dr, Lexington, SC 29072 and is currently estimated at $465,592, approximately $173 per square foot. 149 Mariners Creek Dr is a home located in Lexington County with nearby schools including Lake Murray Elementary School, Beechwood Middle School, and Lexington High School.
Ownership History
Date
Name
Owned For
Owner Type
Purchase Details
Closed on
Jun 15, 2022
Sold by
Brown Neil A
Bought by
Aings Christopher Undre and Aings Natashchia S
Current Estimated Value
Home Financials for this Owner
Home Financials are based on the most recent Mortgage that was taken out on this home.
Original Mortgage
$340,804
Outstanding Balance
$324,276
Interest Rate
5.27%
Mortgage Type
New Conventional
Estimated Equity
$141,316
Purchase Details
Closed on
Mar 10, 2008
Sold by
Brown Colleen M
Bought by
Brown Neil A
Purchase Details
Closed on
Dec 16, 2004
Sold by
Reggie Porter Builders Llc
Bought by
Brown Neil A and Brown Colleen M
Home Financials for this Owner
Home Financials are based on the most recent Mortgage that was taken out on this home.
Original Mortgage
$218,400
Interest Rate
5.61%
Mortgage Type
New Conventional
Create a Home Valuation Report for This Property
The Home Valuation Report is an in-depth analysis detailing your home's value as well as a comparison with similar homes in the area
Home Values in the Area
Average Home Value in this Area
Purchase History
| Date | Buyer | Sale Price | Title Company |
|---|---|---|---|
| Aings Christopher Undre | $443,000 | Morris Law Firm Pa | |
| Brown Neil A | -- | None Available | |
| Brown Neil A | $273,800 | -- |
Source: Public Records
Mortgage History
| Date | Status | Borrower | Loan Amount |
|---|---|---|---|
| Open | Aings Christopher Undre | $340,804 | |
| Previous Owner | Brown Neil A | $218,400 |
Source: Public Records
Tax History Compared to Growth
Tax History
| Year | Tax Paid | Tax Assessment Tax Assessment Total Assessment is a certain percentage of the fair market value that is determined by local assessors to be the total taxable value of land and additions on the property. | Land | Improvement |
|---|---|---|---|---|
| 2024 | $2,646 | $17,720 | $2,800 | $14,920 |
| 2023 | $2,646 | $11,360 | $1,800 | $9,560 |
| 2022 | $1,692 | $11,360 | $1,800 | $9,560 |
| 2020 | $1,735 | $11,360 | $1,800 | $9,560 |
| 2019 | $1,561 | $10,041 | $1,600 | $8,441 |
| 2018 | $1,532 | $10,041 | $1,600 | $8,441 |
| 2017 | $1,486 | $10,041 | $1,600 | $8,441 |
| 2016 | $1,472 | $10,040 | $1,600 | $8,440 |
| 2014 | $1,497 | $10,669 | $2,070 | $8,599 |
| 2013 | -- | $10,670 | $2,070 | $8,600 |
Source: Public Records
Map
Nearby Homes
- 160 Mariners Creek Dr
- 125 Mariners Creek Dr
- 206 Forgotten Trail
- 210 Forgotten Trail
- 200 Forgotten Trail
- South Wind Plan at Walker's Trail
- Southern Breeze Plan at Walker's Trail
- 204 Forgotten Trail
- 224 Forgotten Trail
- 208 Forgotten Trail
- 216 Forgotten Trail
- 220 Forgotten Trail
- 214 Forgotten Trail
- 218 Forgotten Trail
- 222 Forgotten Trail
- 160 Marissa Ln
- 225 Avensong Dr
- 605 Bronze Fantail Run
- 2960 Augusta Hwy
- 524 Silver Dipper Run
- 145 Mariners Creek Dr
- 153 Mariners Creek Dr
- 141 Mariners Creek Dr
- 301 Connie Ct
- 148 Mariners Creek Dr
- 144 Mariners Creek Dr
- 137 Mariners Creek Dr
- 152 Mariners Creek Dr
- 201 Mariners Creek Ct
- 305 Connie Ct
- 205 Mariners Creek Ct
- 300 Connie Ct
- 200 Mariners Creek Ct
- 155 Mariners Creek Dr
- 309 Connie Ct
- 209 Mariners Creek Ct
- 129 Mariners Creek Dr
- 124 Mariners Creek Dr
- 204 Mariners Creek Ct
- 213 Mariners Creek Ct