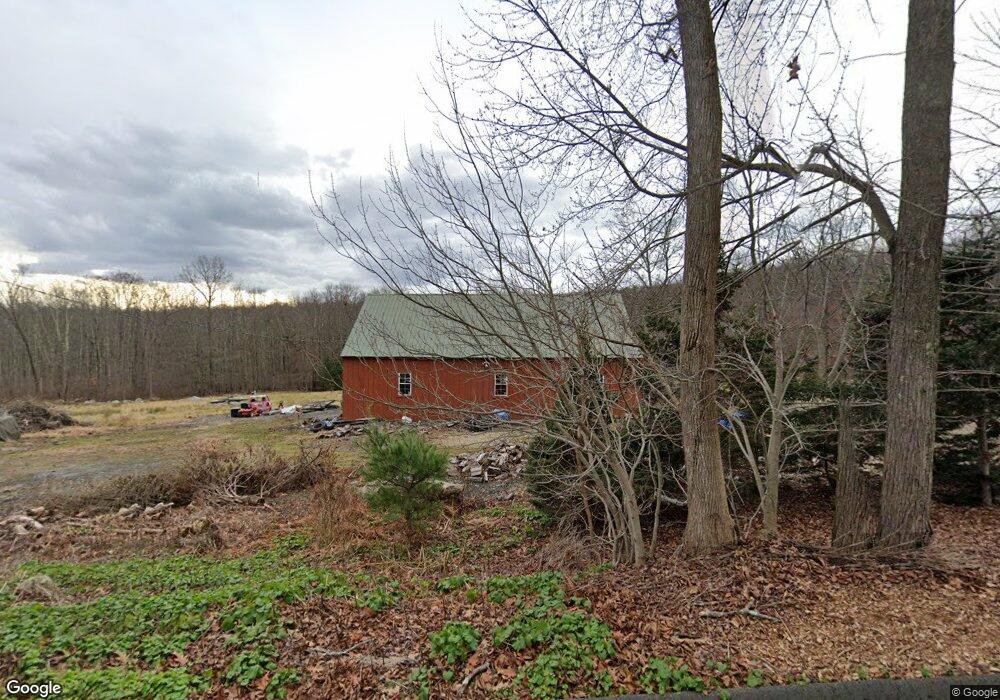
149 Mott Hill Rd East Hampton, CT 06424
Estimated Value: $348,000 - $444,000
3
Beds
2
Baths
1,875
Sq Ft
$215/Sq Ft
Est. Value
About This Home
This home is located at 149 Mott Hill Rd, East Hampton, CT 06424 and is currently estimated at $403,528, approximately $215 per square foot. 149 Mott Hill Rd is a home located in Middlesex County with nearby schools including Memorial School, Center Elementary School, and East Hampton Middle School.
Ownership History
Date
Name
Owned For
Owner Type
Purchase Details
Closed on
May 2, 2017
Sold by
Ritchie Kevin J
Bought by
Ritchie Katherine L and Ritchie Kevin J
Current Estimated Value
Home Financials for this Owner
Home Financials are based on the most recent Mortgage that was taken out on this home.
Original Mortgage
$195,000
Outstanding Balance
$163,048
Interest Rate
4.3%
Mortgage Type
New Conventional
Estimated Equity
$240,480
Purchase Details
Closed on
Sep 30, 1998
Sold by
Est Brewer Mary R and Brewer Eugene J
Bought by
Ritchie Kevin J
Home Financials for this Owner
Home Financials are based on the most recent Mortgage that was taken out on this home.
Original Mortgage
$77,400
Interest Rate
6.89%
Create a Home Valuation Report for This Property
The Home Valuation Report is an in-depth analysis detailing your home's value as well as a comparison with similar homes in the area
Home Values in the Area
Average Home Value in this Area
Purchase History
| Date | Buyer | Sale Price | Title Company |
|---|---|---|---|
| Ritchie Katherine L | -- | -- | |
| Ritchie Katherine L | -- | -- | |
| Ritchie Kevin J | $86,000 | -- | |
| Ritchie Kevin J | $86,000 | -- |
Source: Public Records
Mortgage History
| Date | Status | Borrower | Loan Amount |
|---|---|---|---|
| Open | Ritchie Katherine L | $195,000 | |
| Previous Owner | Ritchie Kevin J | $100,000 | |
| Previous Owner | Ritchie Kevin J | $53,000 | |
| Previous Owner | Ritchie Kevin J | $77,400 |
Source: Public Records
Tax History
| Year | Tax Paid | Tax Assessment Tax Assessment Total Assessment is a certain percentage of the fair market value that is determined by local assessors to be the total taxable value of land and additions on the property. | Land | Improvement |
|---|---|---|---|---|
| 2025 | $6,679 | $168,200 | $58,460 | $109,740 |
| 2024 | $6,398 | $168,200 | $58,460 | $109,740 |
| 2023 | $6,065 | $168,200 | $58,460 | $109,740 |
| 2022 | $5,830 | $168,200 | $58,460 | $109,740 |
| 2021 | $5,808 | $168,200 | $58,460 | $109,740 |
| 2020 | $5,503 | $166,060 | $59,580 | $106,480 |
| 2019 | $5,665 | $170,930 | $61,250 | $109,680 |
| 2018 | $5,354 | $170,930 | $61,250 | $109,680 |
| 2017 | $5,354 | $170,930 | $61,250 | $109,680 |
| 2016 | $5,032 | $170,930 | $61,250 | $109,680 |
| 2015 | $4,135 | $148,840 | $61,480 | $87,360 |
| 2014 | $3,597 | $148,840 | $61,480 | $87,360 |
Source: Public Records
Map
Nearby Homes
- 164 Mott Hill Rd
- 43 Brewer Rd
- 168 Mott Hill Rd
- 38 Brewer Rd
- 170 Mott Hill Rd
- 36 Brewer Rd
- 7 Fernwood Rd
- 172 Mott Hill Rd
- 32 Brewer Rd
- 148 Mott Hill Rd
- 9 Fernwood Rd
- 30 Brewer Rd
- 174 Mott Hill Rd
- 11 Fernwood Rd
- 8 Fernwood Rd
- 28 Brewer Rd
- 10 Fernwood Dr
- 140 Mott Hill Rd
- 138 Mott Hill Rd
- 176 Mott Hill Rd
Your Personal Tour Guide
Ask me questions while you tour the home.