149 Oak St Foxboro, MA 02035
Estimated Value: $466,000 - $661,000
About This Home
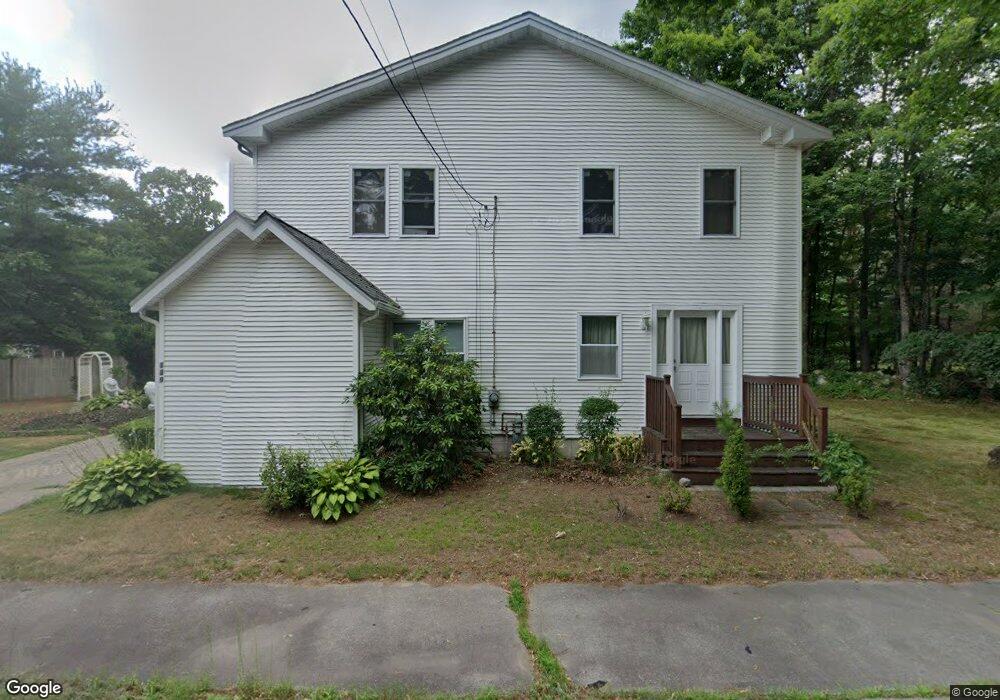
This home is located at 149 Oak St, Foxboro, MA 02035 and is currently estimated at $586,240, approximately $0 per square foot. 149 Oak St is a home located in Norfolk County with nearby schools including Foxborough High School, Foxborough Regional Charter School, and The Sage School.
Ownership History
We collect this data history from publicly available records. To have your information removed, we recommend requesting removal directly through your county’s website.
Purchase Details
Home Financials for this Owner
Home Financials are based on the most recent Mortgage that was taken out on this home.Home Values in the Area
Average Home Value in this Area
Purchase History
We collect this data history from publicly available records. To have your information removed, we recommend requesting removal directly through your county’s website.
| Date | Buyer | Sale Price | Title Company |
|---|---|---|---|
| $252,000 | -- |
Mortgage History
We collect this data history from publicly available records. To have your information removed, we recommend requesting removal directly through your county’s website.
| Date | Status | Borrower | Loan Amount |
|---|---|---|---|
| Open | $201,600 |
Tax History
We collect this data history from publicly available records. To have your information removed, we recommend requesting removal directly through your county’s website.
| Year | Tax Paid | Tax Assessment Tax Assessment Total Assessment is a certain percentage of the fair market value that is determined by local assessors to be the total taxable value of land and additions on the property. | Land | Improvement |
|---|---|---|---|---|
| 2025 | $5,494 | $415,600 | $189,100 | $226,500 |
| 2024 | $5,545 | $410,400 | $203,800 | $206,600 |
| 2023 | $5,388 | $379,200 | $194,100 | $185,100 |
| 2022 | $5,171 | $356,100 | $174,000 | $182,100 |
| 2021 | $5,097 | $345,800 | $165,300 | $180,500 |
| 2020 | $5,038 | $345,800 | $165,300 | $180,500 |
| 2019 | $4,979 | $338,700 | $165,800 | $172,900 |
| 2018 | $4,549 | $312,200 | $157,500 | $154,700 |
| 2017 | $4,383 | $291,400 | $155,000 | $136,400 |
| 2016 | $4,277 | $288,600 | $149,100 | $139,500 |
| 2015 | $3,945 | $259,700 | $111,100 | $148,600 |
| 2014 | $3,893 | $259,700 | $111,100 | $148,600 |
Map
- 15 Nason Ln
- 9 Grover Ln
- 19 Carter Rd
- 25 Sullivan Way
- 31 Atherton Rd
- 12 Iron Hollow Rd
- 68 Alden St
- 165 Chestnut St Unit 2
- 147 Chestnut St Unit A
- 147 Chestnut St Unit B
- 160 East St
- 15 Eastman Ave
- 8 Weyman Ln
- 109 Cocasset St
- 52 Morse St
- 11 Black Elk Rd
- 12 Elm St
- 1 Ledgeville Ave
- 2 Margaret Rd
- 214 Mechanic St
Ask me questions while you tour the home.