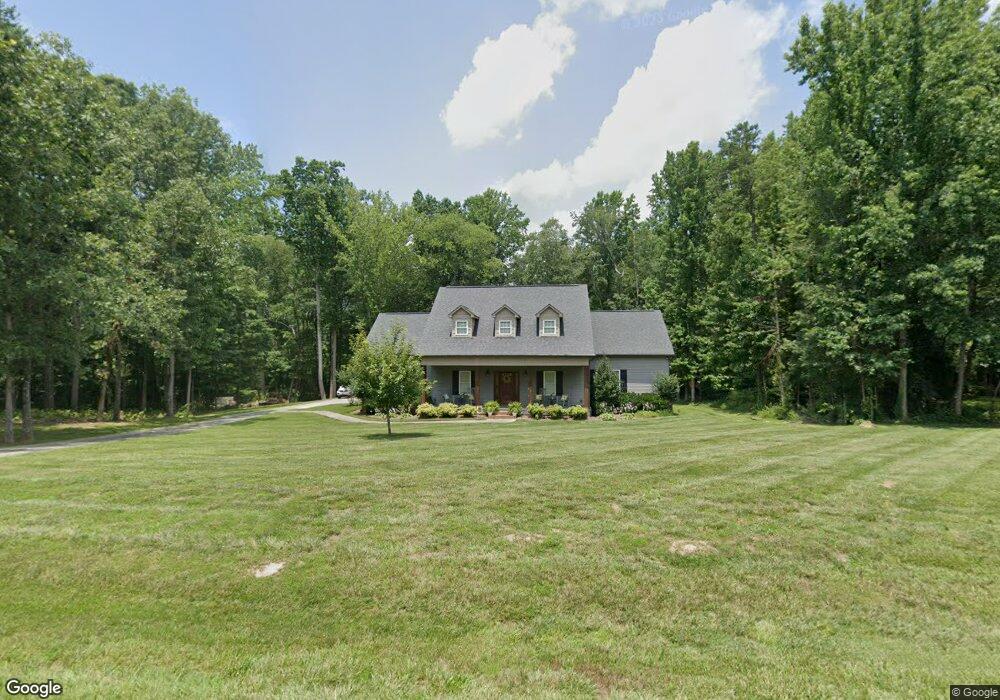
149 Persimmon Creek Rd Kings Mountain, NC 28086
Estimated Value: $521,622 - $776,000
--
Bed
--
Bath
3,724
Sq Ft
$172/Sq Ft
Est. Value
About This Home
This home is located at 149 Persimmon Creek Rd, Kings Mountain, NC 28086 and is currently estimated at $641,906, approximately $172 per square foot. 149 Persimmon Creek Rd is a home with nearby schools including North Elementary School, Kings Mountain Middle, and Kings Mountain Intermediate School.
Ownership History
Date
Name
Owned For
Owner Type
Purchase Details
Closed on
Apr 30, 2024
Sold by
Huss Jonathan Brad and Huss Jada Anne
Bought by
Huss Jonathan Brad and Huss Jada Anne
Current Estimated Value
Purchase Details
Closed on
Sep 25, 2019
Sold by
Huss Jenathan B and Huss Jada Anne
Bought by
Huss Jenathan B and Huss Jada Anne
Home Financials for this Owner
Home Financials are based on the most recent Mortgage that was taken out on this home.
Original Mortgage
$292,800
Interest Rate
3.6%
Mortgage Type
New Conventional
Purchase Details
Closed on
Sep 18, 2009
Sold by
Alexander Charles L and Alexander Reginald K
Bought by
Huss Jonathan B and Huss Jada Anne
Home Financials for this Owner
Home Financials are based on the most recent Mortgage that was taken out on this home.
Original Mortgage
$27,000
Interest Rate
5.15%
Mortgage Type
Purchase Money Mortgage
Create a Home Valuation Report for This Property
The Home Valuation Report is an in-depth analysis detailing your home's value as well as a comparison with similar homes in the area
Home Values in the Area
Average Home Value in this Area
Purchase History
| Date | Buyer | Sale Price | Title Company |
|---|---|---|---|
| Huss Jonathan Brad | -- | None Listed On Document | |
| Huss Jonathan Brad | -- | None Listed On Document | |
| Huss Jenathan B | -- | None Available | |
| Huss Jonathan B | $36,500 | None Available |
Source: Public Records
Mortgage History
| Date | Status | Borrower | Loan Amount |
|---|---|---|---|
| Previous Owner | Huss Jenathan B | $292,800 | |
| Previous Owner | Huss Jonathan B | $27,000 |
Source: Public Records
Tax History Compared to Growth
Tax History
| Year | Tax Paid | Tax Assessment Tax Assessment Total Assessment is a certain percentage of the fair market value that is determined by local assessors to be the total taxable value of land and additions on the property. | Land | Improvement |
|---|---|---|---|---|
| 2025 | $3,861 | $608,064 | $38,469 | $569,595 |
| 2024 | $3,391 | $423,439 | $34,482 | $388,957 |
| 2023 | $3,391 | $423,439 | $34,482 | $388,957 |
| 2022 | $3,374 | $423,439 | $34,482 | $388,957 |
| 2021 | $3,391 | $423,439 | $34,482 | $388,957 |
| 2020 | $2,549 | $305,415 | $34,482 | $270,933 |
| 2019 | $2,549 | $305,415 | $34,482 | $270,933 |
| 2018 | $2,548 | $305,415 | $34,482 | $270,933 |
| 2017 | $2,535 | $305,415 | $34,482 | $270,933 |
| 2016 | $2,431 | $305,415 | $34,482 | $270,933 |
| 2015 | $2,304 | $283,747 | $32,068 | $251,679 |
| 2014 | $2,304 | $283,747 | $32,068 | $251,679 |
Source: Public Records
Map
Nearby Homes
- 123 Gold Run Ct
- 105 Gold Run Ct
- 101 Long Meadows Dr
- 331 Oak Grove Rd Unit 7
- 106 Kelly Marie
- 215 J Robinson Pkwy
- 124 Rollingbrook Rd
- 608 Rollingbrook Rd
- 1521 N Piedmont Ave
- 104 Ole Farm Place
- 000 Putnam Lake Rd
- 1505 N Cansler St
- 115 Patterson Rd
- 167 Patterson Rd
- 155 Patterson Rd
- 1310 N Piedmont Ave
- 1575 Lewis Farm Rd
- 1220 N Piedmont Ave
- 524 Waco Rd
- 1427 Merrimont Ave
- 129 Lucky Strike Dr
- 153 Persimmon Creek Rd
- 148 Persimmon Creek Rd
- 154 Persimmon Creek Rd
- 119 Lucky Strike Dr
- 145 Persimmon Creek Rd
- 125 Lucky Strike Dr
- 104 Prospector Dr
- 157 Persimmon Creek Rd
- 144 Persimmon Creek Rd
- 00 Prospector Dr
- 101 Prospector Dr
- 106 Prospector Dr
- 103 Prospector Dr
- 105 Prospector Dr
- 107 Prospector Dr
- 162 Persimmon Creek Rd
- 140 Persimmon Creek Rd
- 114 Lucky Strike Dr
- 118 Lucky Strike Dr