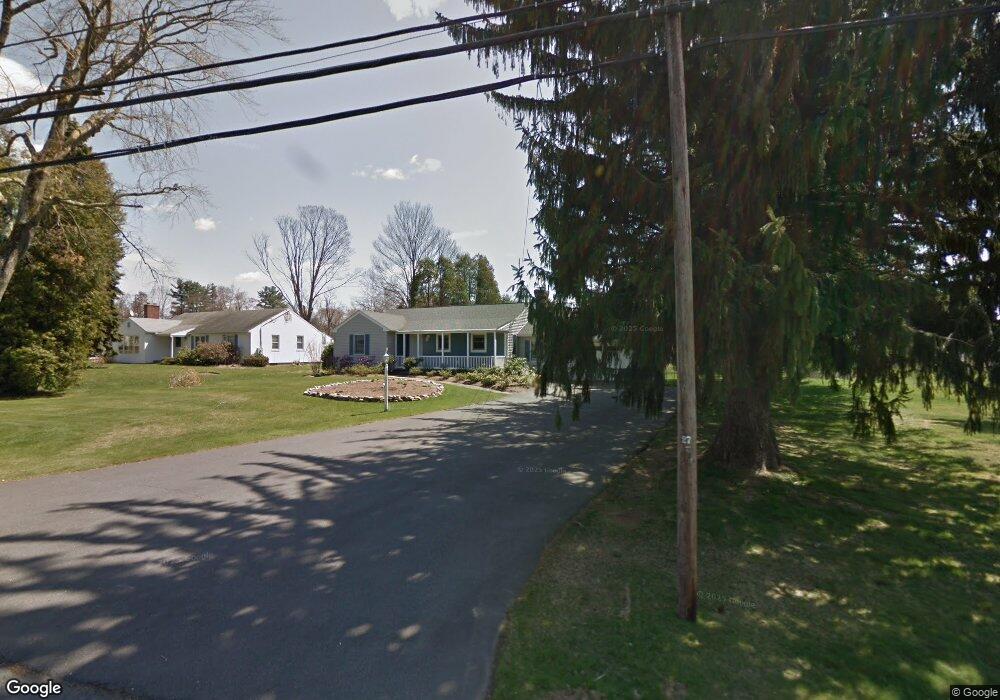
149 Porter Rd East Longmeadow, MA 01028
Estimated Value: $267,000 - $350,116
2
Beds
1
Bath
1,272
Sq Ft
$253/Sq Ft
Est. Value
About This Home
This home is located at 149 Porter Rd, East Longmeadow, MA 01028 and is currently estimated at $321,529, approximately $252 per square foot. 149 Porter Rd is a home located in Hampden County with nearby schools including Meadowbrook Elementary School, Birchland Park Middle School, and East Longmeadow High School.
Ownership History
Date
Name
Owned For
Owner Type
Purchase Details
Closed on
Aug 2, 2021
Sold by
Gwozdz Gail B
Bought by
Chakrabarti Alicia N
Current Estimated Value
Home Financials for this Owner
Home Financials are based on the most recent Mortgage that was taken out on this home.
Original Mortgage
$140,000
Outstanding Balance
$127,361
Interest Rate
2.93%
Mortgage Type
Purchase Money Mortgage
Estimated Equity
$194,168
Purchase Details
Closed on
Nov 6, 2014
Sold by
Bortle Nancy R Est
Bought by
Nancy R Bortle T
Purchase Details
Closed on
Jan 26, 2004
Sold by
Miller Christine B and Miller Christine Bortl
Bought by
Miller Christine Bortl and Bortle Nancy R
Create a Home Valuation Report for This Property
The Home Valuation Report is an in-depth analysis detailing your home's value as well as a comparison with similar homes in the area
Home Values in the Area
Average Home Value in this Area
Purchase History
| Date | Buyer | Sale Price | Title Company |
|---|---|---|---|
| Chakrabarti Alicia N | $175,000 | None Available | |
| Nancy R Bortle T | -- | -- | |
| Miller Christine Bortl | -- | -- |
Source: Public Records
Mortgage History
| Date | Status | Borrower | Loan Amount |
|---|---|---|---|
| Open | Chakrabarti Alicia N | $140,000 |
Source: Public Records
Tax History Compared to Growth
Tax History
| Year | Tax Paid | Tax Assessment Tax Assessment Total Assessment is a certain percentage of the fair market value that is determined by local assessors to be the total taxable value of land and additions on the property. | Land | Improvement |
|---|---|---|---|---|
| 2025 | $5,598 | $302,900 | $122,700 | $180,200 |
| 2024 | $5,360 | $289,100 | $122,700 | $166,400 |
| 2023 | $5,069 | $264,000 | $111,400 | $152,600 |
| 2022 | $4,837 | $238,400 | $100,700 | $137,700 |
| 2021 | $4,741 | $225,100 | $93,200 | $131,900 |
| 2020 | $4,547 | $218,200 | $93,200 | $125,000 |
| 2019 | $4,355 | $211,900 | $90,300 | $121,600 |
| 2018 | $4,149 | $202,600 | $90,300 | $112,300 |
| 2017 | $4,125 | $198,600 | $88,700 | $109,900 |
| 2016 | $4,110 | $194,600 | $85,900 | $108,700 |
| 2015 | $4,032 | $194,600 | $85,900 | $108,700 |
Source: Public Records
Map
Nearby Homes