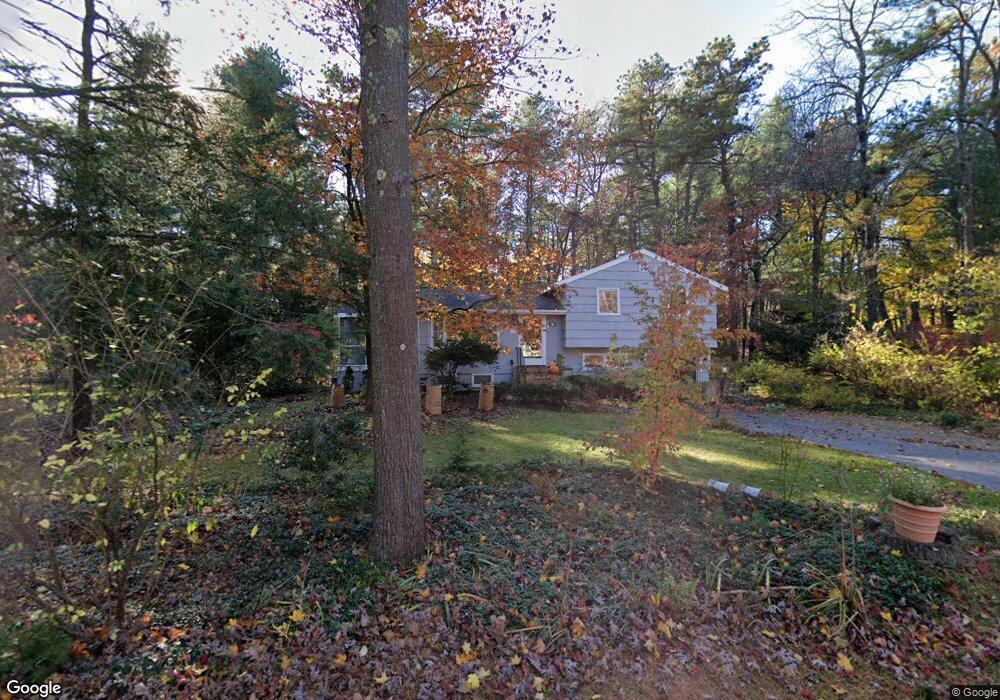
149 Pratts Mill Rd Sudbury, MA 01776
Estimated Value: $719,620 - $815,000
3
Beds
2
Baths
1,050
Sq Ft
$742/Sq Ft
Est. Value
About This Home
This home is located at 149 Pratts Mill Rd, Sudbury, MA 01776 and is currently estimated at $778,655, approximately $741 per square foot. 149 Pratts Mill Rd is a home located in Middlesex County with nearby schools including Peter Noyes Elementary School, Ephraim Curtis Middle School, and Lincoln-Sudbury Regional High School.
Ownership History
Date
Name
Owned For
Owner Type
Purchase Details
Closed on
Oct 8, 2004
Sold by
Tucker Michael and Tucker Sondra
Bought by
Pohlman Robert F and Pohlman Sandra K
Current Estimated Value
Home Financials for this Owner
Home Financials are based on the most recent Mortgage that was taken out on this home.
Original Mortgage
$342,400
Interest Rate
5.84%
Mortgage Type
Purchase Money Mortgage
Purchase Details
Closed on
Jun 19, 1998
Sold by
Calderini Thomas J and Calderini Kathleen D
Bought by
Tucker Michael and Tucker Sondra
Purchase Details
Closed on
Sep 27, 1991
Sold by
Bakken David G and Bakken Elizabeth
Bought by
Calderini Thomas J and Calderini Kathleen
Purchase Details
Closed on
May 21, 1987
Sold by
Stacy Lorraine D
Bought by
Bakken David G
Create a Home Valuation Report for This Property
The Home Valuation Report is an in-depth analysis detailing your home's value as well as a comparison with similar homes in the area
Home Values in the Area
Average Home Value in this Area
Purchase History
| Date | Buyer | Sale Price | Title Company |
|---|---|---|---|
| Pohlman Robert F | $428,000 | -- | |
| Tucker Michael | $248,000 | -- | |
| Calderini Thomas J | $189,500 | -- | |
| Bakken David G | $202,000 | -- |
Source: Public Records
Mortgage History
| Date | Status | Borrower | Loan Amount |
|---|---|---|---|
| Open | Bakken David G | $324,000 | |
| Closed | Pohlman Robert F | $342,400 | |
| Previous Owner | Bakken David G | $250,000 |
Source: Public Records
Tax History
| Year | Tax Paid | Tax Assessment Tax Assessment Total Assessment is a certain percentage of the fair market value that is determined by local assessors to be the total taxable value of land and additions on the property. | Land | Improvement |
|---|---|---|---|---|
| 2025 | $10,153 | $693,500 | $410,200 | $283,300 |
| 2024 | $9,818 | $672,000 | $398,200 | $273,800 |
| 2023 | $9,664 | $612,800 | $361,900 | $250,900 |
| 2022 | $9,128 | $505,700 | $332,100 | $173,600 |
| 2021 | $8,882 | $471,700 | $332,100 | $139,600 |
| 2020 | $8,703 | $471,700 | $332,100 | $139,600 |
| 2019 | $8,448 | $471,700 | $332,100 | $139,600 |
| 2018 | $8,128 | $453,300 | $336,000 | $117,300 |
| 2017 | $7,696 | $433,800 | $324,400 | $109,400 |
| 2016 | $7,480 | $420,200 | $312,100 | $108,100 |
| 2015 | $6,998 | $397,600 | $297,400 | $100,200 |
| 2014 | $6,934 | $384,600 | $287,000 | $97,600 |
Source: Public Records
Map
Nearby Homes
- 25 Poplar St
- 30 Kendall Rd
- 557 Dutton Rd Unit 2
- 53 Pine St
- 62 Churchill St
- 11 October Rd
- 30 Harness Ln
- 30 Rolling Ln
- 15 Huckleberry Ln
- 11 Great Lake Dr
- 8 Twillingate Rd
- 45 Webster Cir
- 0 Robbins Rd
- 11 Farmstead Ln Unit 11
- 0 Boston Post Rd
- 355 Maynard Rd
- 55 Widow Rites Ln
- 45 Widow Rites Ln
- 111 Willis Rd
- 25 Plantation Cir
- 153 Pratts Mill Rd
- 150 Pratts Mill Rd
- 143 Pratts Mill Rd
- 2 Briar Patch Ln
- 138 Pratts Mill Rd
- 137 Pratts Mill Rd
- 10 Briar Patch Ln
- 126 Hemlock Rd
- 120 Hemlock Rd
- 162 Pratts Mill Rd
- 161 Pratts Mill Rd
- 11 West St
- 132 Pratts Mill Rd
- 131 Pratts Mill Rd
- 15 West St
- 112 Hemlock Rd
- 18 Briar Patch Ln
- 7 Brentwood Rd
- 125 Hemlock Rd
- 32 Willow Rd
Your Personal Tour Guide
Ask me questions while you tour the home.