149 Rice St Austin, IN 47102
Estimated Value: $154,365 - $186,000
3
Beds
2
Baths
1,300
Sq Ft
$130/Sq Ft
Est. Value
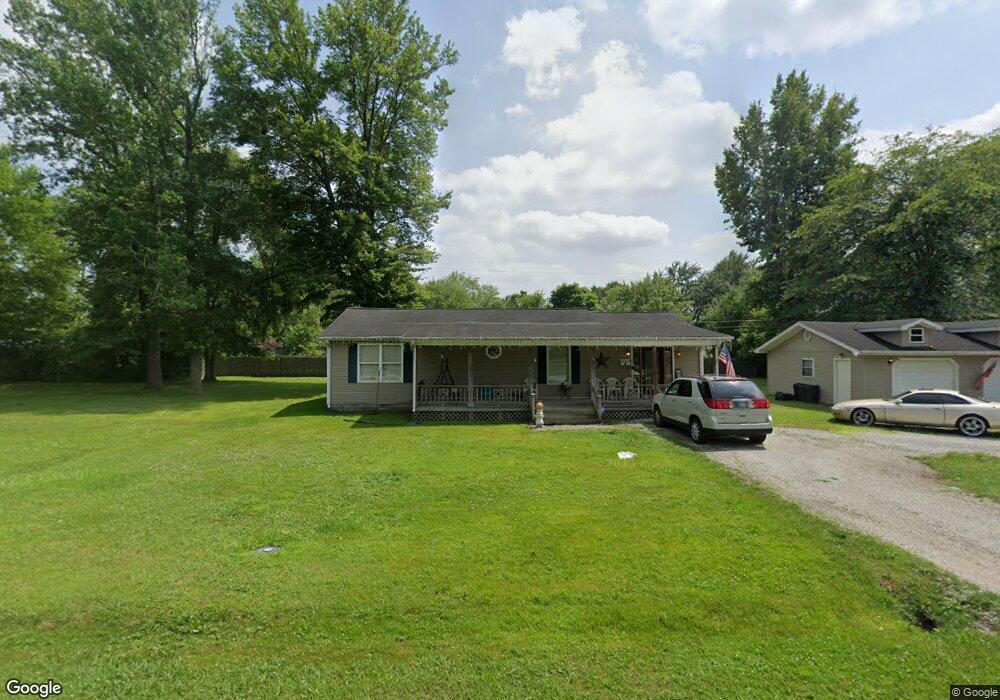
About This Home
This home is located at 149 Rice St, Austin, IN 47102 and is currently estimated at $169,591, approximately $130 per square foot. 149 Rice St is a home located in Scott County with nearby schools including Austin Elementary School, Austin Middle School, and Austin High School.
Ownership History
Date
Name
Owned For
Owner Type
Purchase Details
Closed on
Sep 6, 2006
Sold by
Ocwen Federal Bank Fsb
Bought by
Campbell Harold and Campbell Spellman Joyce
Current Estimated Value
Purchase Details
Closed on
Aug 9, 2006
Sold by
Ocwen Federal Bank Fsb
Bought by
Campbell Harold and Spellman Joyce
Create a Home Valuation Report for This Property
The Home Valuation Report is an in-depth analysis detailing your home's value as well as a comparison with similar homes in the area
Home Values in the Area
Average Home Value in this Area
Purchase History
| Date | Buyer | Sale Price | Title Company |
|---|---|---|---|
| Campbell Harold | $46,000 | -- | |
| Campbell Harold | -- | None Available |
Source: Public Records
Tax History
| Year | Tax Paid | Tax Assessment Tax Assessment Total Assessment is a certain percentage of the fair market value that is determined by local assessors to be the total taxable value of land and additions on the property. | Land | Improvement |
|---|---|---|---|---|
| 2025 | $673 | $85,500 | $13,500 | $72,000 |
| 2024 | $673 | $78,800 | $13,500 | $65,300 |
| 2023 | $591 | $72,300 | $13,500 | $58,800 |
| 2022 | $538 | $67,100 | $13,500 | $53,600 |
| 2021 | $495 | $62,100 | $13,500 | $48,600 |
| 2020 | $520 | $62,400 | $13,500 | $48,900 |
| 2019 | $503 | $62,600 | $13,500 | $49,100 |
| 2018 | $525 | $67,000 | $13,500 | $53,500 |
| 2017 | $504 | $67,400 | $13,500 | $53,900 |
| 2016 | $488 | $64,800 | $13,500 | $51,300 |
| 2014 | $513 | $67,100 | $19,300 | $47,800 |
| 2013 | $513 | $71,200 | $19,400 | $51,800 |
Source: Public Records
Map
Nearby Homes
- 133 Rice St
- 140 Paulanna Ave
- 148 Rice St
- 160 Rice St
- 134 Rice St
- 117 Rice St
- 173 Rice St
- 116 Paulanna Ave
- 170 Paulanna Ave
- 139 Paulanna Ave
- 147 Paulanna Ave
- 155 Paulanna Ave
- 137 Paulanna Ave
- 541 Broadway St
- 555 Broadway St
- 533 Broadway St
- 563 Broadway St
- 527 Broadway St
- 765 N Church St
- 180 Paulanna Ave
Your Personal Tour Guide
Ask me questions while you tour the home.