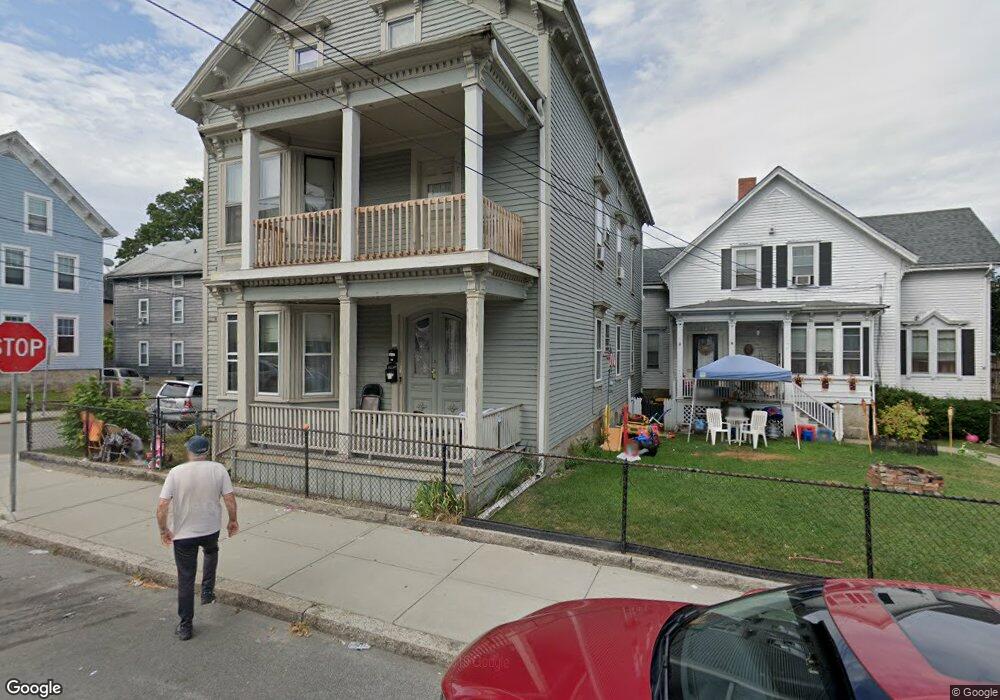
149 Ridge St Fall River, MA 02721
Corky Row NeighborhoodEstimated Value: $540,000 - $613,000
9
Beds
4
Baths
3,394
Sq Ft
$170/Sq Ft
Est. Value
About This Home
This home is located at 149 Ridge St, Fall River, MA 02721 and is currently estimated at $575,667, approximately $169 per square foot. 149 Ridge St is a home located in Bristol County with nearby schools including Henry Lord Community School, B M C Durfee High School, and Argosy Collegiate Charter School.
Ownership History
Date
Name
Owned For
Owner Type
Purchase Details
Closed on
Feb 14, 2008
Sold by
Brilhante Gregory A and Proulx Richard R
Bought by
Brilhante Gregory A
Current Estimated Value
Purchase Details
Closed on
Mar 30, 2007
Sold by
Pires Arthur and Moxie Debra Pires
Bought by
Brilhante Gregory A and Proulx Richard R
Home Financials for this Owner
Home Financials are based on the most recent Mortgage that was taken out on this home.
Original Mortgage
$344,000
Interest Rate
6.33%
Mortgage Type
Purchase Money Mortgage
Create a Home Valuation Report for This Property
The Home Valuation Report is an in-depth analysis detailing your home's value as well as a comparison with similar homes in the area
Home Values in the Area
Average Home Value in this Area
Purchase History
| Date | Buyer | Sale Price | Title Company |
|---|---|---|---|
| Brilhante Gregory A | -- | -- | |
| Brilhante Gregory A | $345,000 | -- |
Source: Public Records
Mortgage History
| Date | Status | Borrower | Loan Amount |
|---|---|---|---|
| Previous Owner | Brilhante Gregory A | $344,000 |
Source: Public Records
Tax History Compared to Growth
Tax History
| Year | Tax Paid | Tax Assessment Tax Assessment Total Assessment is a certain percentage of the fair market value that is determined by local assessors to be the total taxable value of land and additions on the property. | Land | Improvement |
|---|---|---|---|---|
| 2025 | $5,551 | $484,800 | $104,700 | $380,100 |
| 2024 | $5,311 | $462,200 | $100,800 | $361,400 |
| 2023 | $4,661 | $379,900 | $83,300 | $296,600 |
| 2022 | $4,141 | $328,100 | $79,300 | $248,800 |
| 2021 | $3,915 | $283,100 | $75,500 | $207,600 |
| 2020 | $3,523 | $243,800 | $74,400 | $169,400 |
| 2019 | $3,005 | $206,100 | $71,600 | $134,500 |
| 2018 | $2,807 | $192,000 | $77,600 | $114,400 |
| 2017 | $2,636 | $188,300 | $73,900 | $114,400 |
| 2016 | $2,592 | $190,200 | $78,700 | $111,500 |
| 2015 | $2,488 | $190,200 | $78,700 | $111,500 |
| 2014 | $2,500 | $198,700 | $76,400 | $122,300 |
Source: Public Records
Map
Nearby Homes
- 151 Whipple St
- 48 Ridge St
- 256 Whipple St
- 568 2nd St
- 452 S Main St
- 526 3rd St
- 709 Second St
- 81 Hunter St
- 75 Hunter St
- 77 Hunter St
- 79 Hunter St
- 0 Branch St
- 337 Columbia St
- 452 Osborn St
- 403 Division St Unit 14
- 403 Division St Unit 13
- 403 Division St Unit 5
- 403 Division St Unit 9
- 403 Division St Unit 8
- 403 Division St Unit 11
- 149 Ridge St Unit 3
- 145 Ridge St
- 133 Ridge St
- 76 Cottage St
- 108 Cottage St
- 123 Ridge St
- 134 Ridge St
- 95 Cottage St
- 95 Cottage St Unit 1st
- 60 Cottage St
- 60 Cottage St Unit 2
- 83 Cottage St
- 111 Cottage St
- 124 Cottage St
- 126 Ridge St
- 73 Cottage St
- 111 Ridge St
- 111 Ridge St Unit 2
- 63 Cottage St
- 50 Cottage St