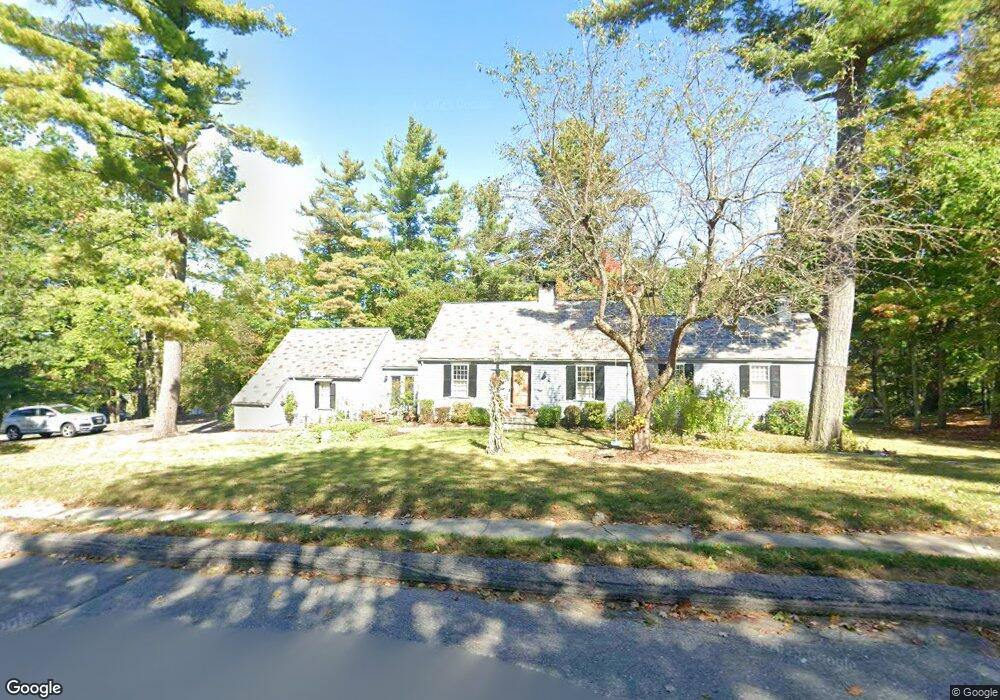
149 Ryefield Rd Fitchburg, MA 01420
Estimated Value: $522,313 - $573,000
3
Beds
2
Baths
2,318
Sq Ft
$237/Sq Ft
Est. Value
About This Home
This home is located at 149 Ryefield Rd, Fitchburg, MA 01420 and is currently estimated at $549,328, approximately $236 per square foot. 149 Ryefield Rd is a home located in Worcester County with nearby schools including Crocker Elementary School, South Street Elementary School, and Fitchburg High School.
Ownership History
Date
Name
Owned For
Owner Type
Purchase Details
Closed on
Aug 13, 2010
Sold by
Bujold Chris V
Bought by
Bujold Chris V and Leblanc Rhea A
Current Estimated Value
Purchase Details
Closed on
Feb 1, 2007
Sold by
Bujold Christina L and Hebert Christina Lynn
Bought by
Bujold Christopher V
Purchase Details
Closed on
Sep 29, 2003
Sold by
Sciabarrasi John A and Antaya Sciabarrasi M
Bought by
Hebert Christina Lynn and Bujold Christopher V
Home Financials for this Owner
Home Financials are based on the most recent Mortgage that was taken out on this home.
Original Mortgage
$260,000
Interest Rate
6.29%
Mortgage Type
Purchase Money Mortgage
Purchase Details
Closed on
Apr 30, 1999
Sold by
Raboin Gregory R and Raboin Sherri R
Bought by
Sciabarrasi John A and Sciabarrasi Michelle A
Home Financials for this Owner
Home Financials are based on the most recent Mortgage that was taken out on this home.
Original Mortgage
$164,000
Interest Rate
6.95%
Mortgage Type
Purchase Money Mortgage
Create a Home Valuation Report for This Property
The Home Valuation Report is an in-depth analysis detailing your home's value as well as a comparison with similar homes in the area
Home Values in the Area
Average Home Value in this Area
Purchase History
| Date | Buyer | Sale Price | Title Company |
|---|---|---|---|
| Bujold Chris V | -- | -- | |
| Bujold Christopher V | $325,000 | -- | |
| Hebert Christina Lynn | $325,000 | -- | |
| Sciabarrasi John A | $205,000 | -- |
Source: Public Records
Mortgage History
| Date | Status | Borrower | Loan Amount |
|---|---|---|---|
| Previous Owner | Hebert Christina Lynn | $260,000 | |
| Previous Owner | Hebert Christina Lynn | $65,000 | |
| Previous Owner | Sciabarrasi John A | $25,000 | |
| Previous Owner | Sciabarrasi John A | $164,000 | |
| Previous Owner | Sciabarrasi John A | $164,000 |
Source: Public Records
Tax History Compared to Growth
Tax History
| Year | Tax Paid | Tax Assessment Tax Assessment Total Assessment is a certain percentage of the fair market value that is determined by local assessors to be the total taxable value of land and additions on the property. | Land | Improvement |
|---|---|---|---|---|
| 2025 | $6,134 | $454,000 | $112,200 | $341,800 |
| 2024 | $6,322 | $426,900 | $93,800 | $333,100 |
| 2023 | $5,942 | $370,900 | $83,400 | $287,500 |
| 2022 | $5,829 | $331,000 | $84,900 | $246,100 |
| 2021 | $6,190 | $325,300 | $81,900 | $243,400 |
| 2020 | $5,943 | $301,500 | $80,400 | $221,100 |
| 2019 | $5,506 | $268,700 | $81,900 | $186,800 |
| 2018 | $5,255 | $250,100 | $76,000 | $174,100 |
| 2017 | $4,895 | $227,800 | $74,500 | $153,300 |
| 2016 | $4,605 | $216,900 | $68,500 | $148,400 |
| 2015 | $4,436 | $214,500 | $65,500 | $149,000 |
| 2014 | $4,271 | $215,400 | $65,500 | $149,900 |
Source: Public Records
Map
Nearby Homes
- 62 Wendell Rd
- 218 Marshall St
- 15 Will Thompson Way
- 468 Elm St Unit 3
- 205-207 High St
- 202 High St
- 94 Fitch Hill Ave
- 376 Elm St
- 68 Marshall St
- 21-23 Omena Place
- 33-35 Omena Place
- 0 Rindge Rd
- 208 Blossom St
- 855 John Fitch Hwy Unit 44
- 206 Highland Ave
- 154 Pleasant St
- 34 Garnet St
- 5 Jay St
- 90 Mechanic St
- 162 Fisher Rd
- 490 Blossom St
- 490 Blossom St Unit 1
- 150 Ryefield Rd
- 514 Blossom St
- 470 Blossom St
- 135 Ryefield Rd
- 128 Ryefield Rd
- 520 Blossom St Unit Garage
- 520 Blossom St
- 305 Mount Vernon St
- 450 Blossom St
- 475 Blossom St
- 340 Mount Vernon St
- 121 Ryefield Rd
- 525 Blossom St
- 114 Ryefield Rd
- 463 Blossom St
- 46 Apple Tree Hill
- 3C Apple Tree Hill
- 443 Blossom St