149 S Kane St Burlington, WI 53105
Estimated Value: $407,000 - $573,635
3
Beds
4
Baths
2,904
Sq Ft
$176/Sq Ft
Est. Value
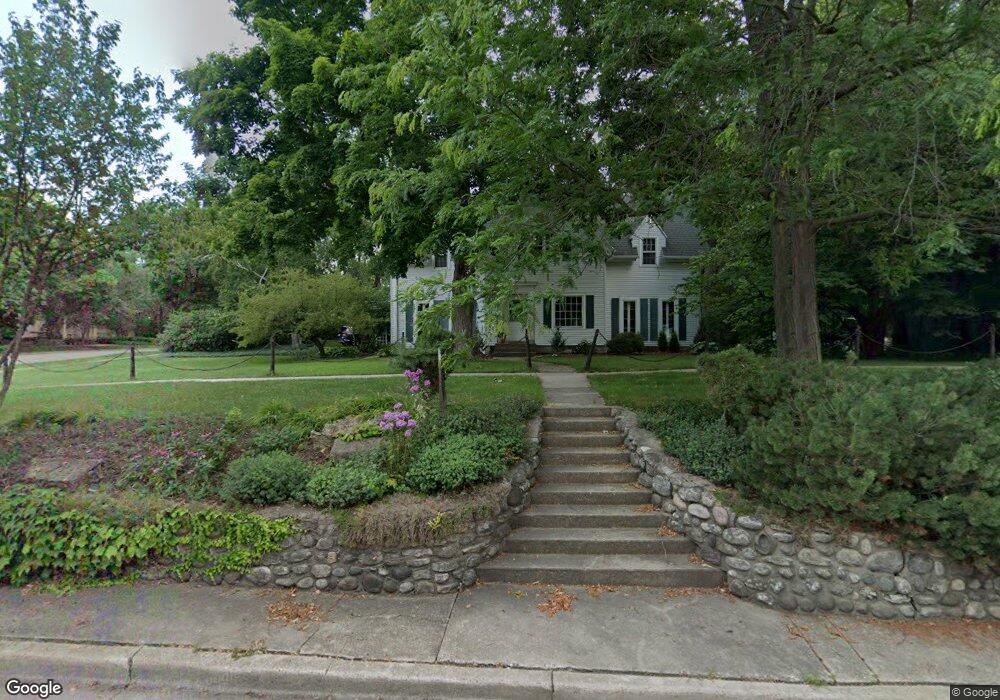
About This Home
This home is located at 149 S Kane St, Burlington, WI 53105 and is currently estimated at $512,409, approximately $176 per square foot. 149 S Kane St is a home located in Racine County with nearby schools including Waller Elementary School, Cooper Montessori School, and Nettie E. Karcher School.
Ownership History
Date
Name
Owned For
Owner Type
Purchase Details
Closed on
Oct 31, 2019
Sold by
Kelly Michael J and Kelly Jean A
Bought by
Sullivan Sarah E and Sullivan Patrick
Current Estimated Value
Home Financials for this Owner
Home Financials are based on the most recent Mortgage that was taken out on this home.
Original Mortgage
$375,000
Outstanding Balance
$329,903
Interest Rate
3.6%
Mortgage Type
New Conventional
Estimated Equity
$182,506
Create a Home Valuation Report for This Property
The Home Valuation Report is an in-depth analysis detailing your home's value as well as a comparison with similar homes in the area
Home Values in the Area
Average Home Value in this Area
Purchase History
| Date | Buyer | Sale Price | Title Company |
|---|---|---|---|
| Sullivan Sarah E | $400,000 | Fidelity Title Inc |
Source: Public Records
Mortgage History
| Date | Status | Borrower | Loan Amount |
|---|---|---|---|
| Open | Sullivan Sarah E | $375,000 |
Source: Public Records
Tax History Compared to Growth
Tax History
| Year | Tax Paid | Tax Assessment Tax Assessment Total Assessment is a certain percentage of the fair market value that is determined by local assessors to be the total taxable value of land and additions on the property. | Land | Improvement |
|---|---|---|---|---|
| 2024 | $7,883 | $542,600 | $34,400 | $508,200 |
| 2023 | $7,726 | $503,800 | $34,400 | $469,400 |
| 2022 | $7,380 | $439,800 | $34,400 | $405,400 |
| 2021 | $7,505 | $401,600 | $34,400 | $367,200 |
| 2020 | $7,187 | $381,800 | $34,400 | $347,400 |
| 2019 | $6,347 | $328,200 | $34,400 | $293,800 |
| 2018 | $6,301 | $317,100 | $34,400 | $282,700 |
| 2017 | $6,764 | $297,900 | $34,400 | $263,500 |
| 2016 | $6,572 | $278,900 | $34,400 | $244,500 |
| 2015 | $6,334 | $278,900 | $34,400 | $244,500 |
| 2014 | $6,586 | $295,200 | $34,400 | $260,800 |
| 2013 | $7,213 | $295,200 | $34,400 | $260,800 |
Source: Public Records
Map
Nearby Homes