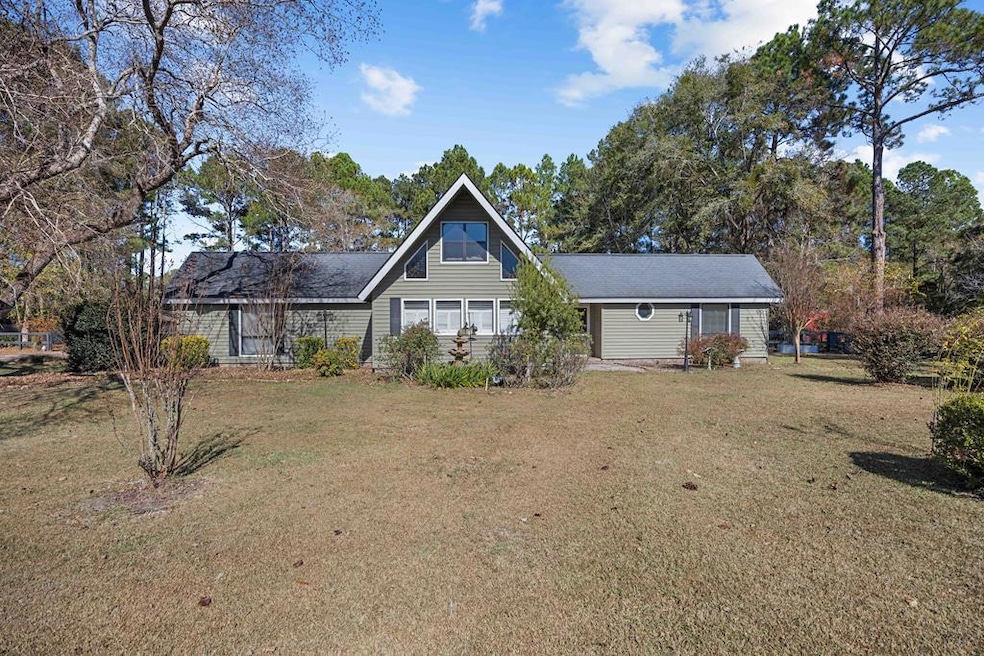
149 Tallokas Cir Moultrie, GA 31788
Estimated payment $1,639/month
Highlights
- Popular Property
- Vaulted Ceiling
- Laundry Room
- Fruit Trees
- No HOA
- Central Heating and Cooling System
About This Home
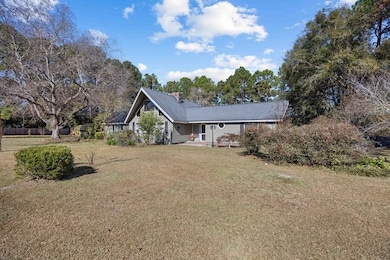
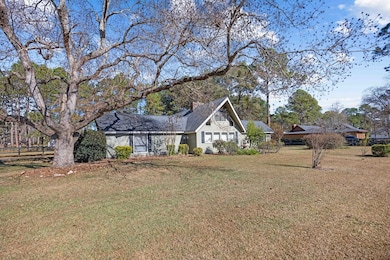
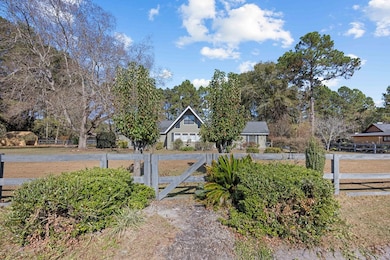
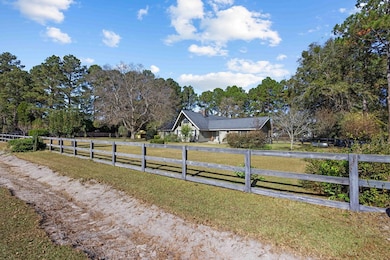
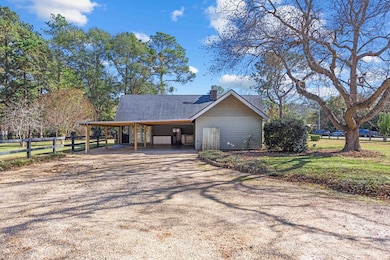
No cookie cutter home here! Take a look at this architectural beauty sitting on 1.24 acres. Lots of room for kids and pets. This home has a stunning A frame center complimented by spacious extensions, flanking both sides. Inside, you'll find a vaulted ceiling with beautiful, exposed wood beams. The kitchen is newly remodeled and has new cabinets, new appliances and an expansive island for all your gatherings. There is a private loft upstairs that can easily be used as a fourth bedroom. The carport was just replaced and is brand new. Don't miss out on this chance to see this beautiful home in the desirable Tallokas area. Call for your appointment today
Listing Agent
Lock & Key Realty Brokerage Phone: 2298908062 License #377689 Listed on: 12/01/2025

Home Details
Home Type
- Single Family
Est. Annual Taxes
- $1,432
Year Built
- Built in 1977
Lot Details
- 1.24 Acre Lot
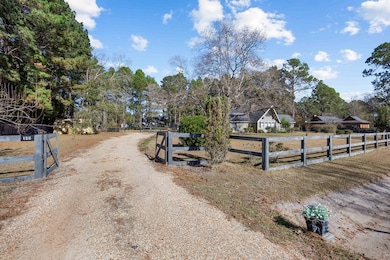
- Fenced
- Fruit Trees
- Property is zoned R-3
Home Design
- Slab Foundation
- Architectural Shingle Roof
- Wood Siding
Interior Spaces
- 2,292 Sq Ft Home
- 1-Story Property
- Vaulted Ceiling
- Laundry Room
Kitchen
- Electric Range
- Dishwasher
Bedrooms and Bathrooms
- 3 Bedrooms
- 2 Full Bathrooms
Parking
- 2 Parking Spaces
- Carport
Utilities
- Central Heating and Cooling System
- Shared Water Source
- Septic Tank
Community Details
- No Home Owners Association
- Tallokas Circle Subdivision
Listing and Financial Details
- Assessor Parcel Number C047A 037
Map
Home Values in the Area
Average Home Value in this Area
Tax History
| Year | Tax Paid | Tax Assessment Tax Assessment Total Assessment is a certain percentage of the fair market value that is determined by local assessors to be the total taxable value of land and additions on the property. | Land | Improvement |
|---|---|---|---|---|
| 2024 | $1,432 | $76,166 | $10,000 | $66,166 |
| 2023 | $1,564 | $69,230 | $10,000 | $59,230 |
| 2022 | $1,314 | $57,174 | $10,000 | $47,174 |
| 2021 | $1,258 | $53,823 | $10,000 | $43,823 |
| 2020 | $1,281 | $53,823 | $10,000 | $43,823 |
| 2019 | $1,368 | $51,779 | $10,000 | $41,779 |
| 2018 | $1,324 | $51,779 | $10,000 | $41,779 |
| 2017 | $1,355 | $51,779 | $10,000 | $41,779 |
| 2016 | $1,373 | $51,779 | $10,000 | $41,779 |
| 2015 | $1,383 | $51,779 | $10,000 | $41,779 |
| 2014 | $1,355 | $51,779 | $10,000 | $41,779 |
| 2013 | -- | $51,779 | $10,000 | $41,779 |
Property History
| Date | Event | Price | List to Sale | Price per Sq Ft |
|---|---|---|---|---|
| 12/01/2025 12/01/25 | For Sale | $289,900 | -- | $126 / Sq Ft |
Purchase History
| Date | Type | Sale Price | Title Company |
|---|---|---|---|
| Warranty Deed | $223,500 | -- | |
| Deed | $117,000 | -- | |
| Deed | $94,000 | -- | |
| Deed | $90,000 | -- | |
| Deed | $79,000 | -- | |
| Deed | $58,500 | -- | |
| Deed | -- | -- |
Mortgage History
| Date | Status | Loan Amount | Loan Type |
|---|---|---|---|
| Open | $219,451 | New Conventional |
Source: South Georgia MLS
MLS Number: 146935
APN: C047A-037
- 125 Inner Cir
- 0 Old Timey Trail
- 31 31st Ave SE
- 410 Indian Trail
- 132 Tallokas Trail
- 4 Baldwin Place SE
- 424 U S Highway 319
- 270 Old Timey Trail
- 7 SE Pheasant Ln
- 0 26th Ave SE
- 35 Cobblestone Blvd SE
- 85 Cobblestone Blvd SE
- 16 Francine Way SE
- 65 Packer Pride Dr SE
- 48 Packer Pride Dr SE
- 204 Nandina Dr
- 124 Flint Dr
- 305 Clubview Dr
- 304 Clubview Dr
- 1935 4th St SE
- 2809 5th St SE
- 517 26th Ave SE
- 3109 Veterans Pkwy S
- 2412 Jacqueline Cir Unit Efficiency Apartment
- 315 15th St SE
- 841 E Central Ave
- 227 2nd Ave SE
- 20 7th St NE
- 516 Georgia 133
- 1043 S Pine St Unit A
- 23841 Us Highway 19 N
- 708 S Parrish Ave
- 600 E 4th St
- 3304 S Hutchinson Ave
- 241 Cove Landing Dr
- 321 Madison Grove Blvd
- 1388 N Pinetree Blvd
- 147 English Ln
- 2448 Cassidy Rd
- 158 Braleigh Ln