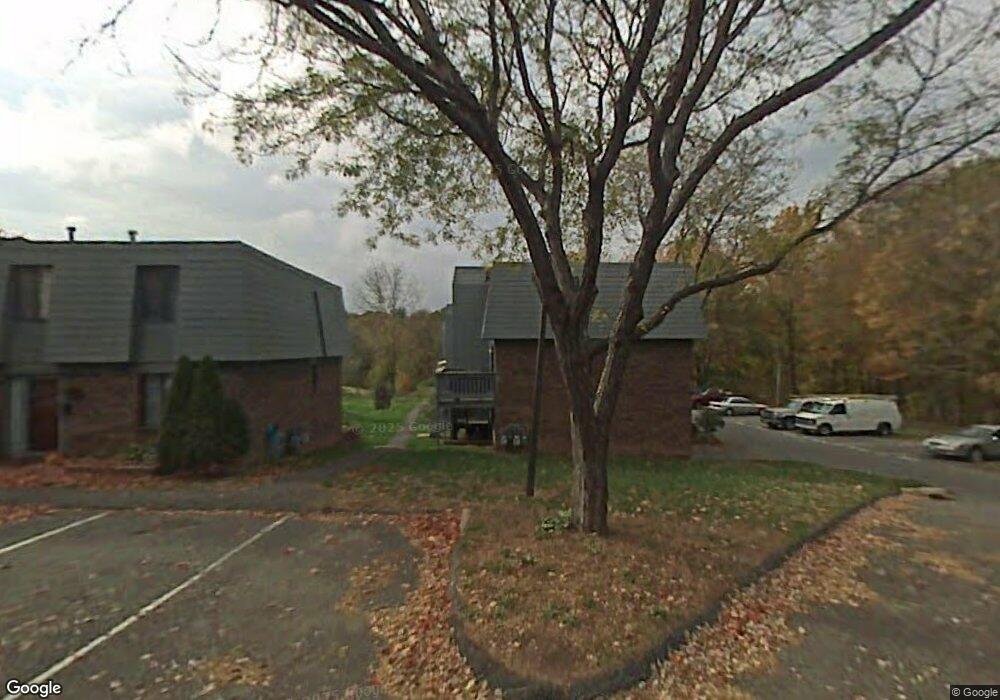
149 Trolley Crossing Ln Middletown, CT 06457
Westfield NeighborhoodEstimated Value: $209,000 - $239,000
2
Beds
2
Baths
1,206
Sq Ft
$186/Sq Ft
Est. Value
About This Home
This home is located at 149 Trolley Crossing Ln, Middletown, CT 06457 and is currently estimated at $223,796, approximately $185 per square foot. 149 Trolley Crossing Ln is a home located in Middlesex County with nearby schools including The Lawrence School and Middletown High School.
Ownership History
Date
Name
Owned For
Owner Type
Purchase Details
Closed on
Mar 29, 2023
Sold by
St Amand Joanne and Gullage Kathleen
Bought by
Aronne Alexis
Current Estimated Value
Home Financials for this Owner
Home Financials are based on the most recent Mortgage that was taken out on this home.
Original Mortgage
$172,161
Outstanding Balance
$166,938
Interest Rate
6.32%
Mortgage Type
FHA
Estimated Equity
$56,858
Purchase Details
Closed on
Dec 14, 2020
Sold by
Rogalewski Johanna
Bought by
Stamand Joanne and Gullage Kathleen
Purchase Details
Closed on
Jun 18, 2010
Sold by
Wilcox Debra Rita
Bought by
Rogalewski Johanna
Home Financials for this Owner
Home Financials are based on the most recent Mortgage that was taken out on this home.
Original Mortgage
$161,555
Interest Rate
4.5%
Mortgage Type
FHA
Purchase Details
Closed on
Oct 9, 2001
Sold by
Davis Sean T and Bolin Kelly J
Bought by
Johnston Debra R
Home Financials for this Owner
Home Financials are based on the most recent Mortgage that was taken out on this home.
Original Mortgage
$94,090
Interest Rate
6.89%
Create a Home Valuation Report for This Property
The Home Valuation Report is an in-depth analysis detailing your home's value as well as a comparison with similar homes in the area
Home Values in the Area
Average Home Value in this Area
Purchase History
| Date | Buyer | Sale Price | Title Company |
|---|---|---|---|
| Aronne Alexis | $188,000 | None Available | |
| Stamand Joanne | $145,300 | None Available | |
| Rogalewski Johanna | $168,000 | -- | |
| Johnston Debra R | $97,000 | -- |
Source: Public Records
Mortgage History
| Date | Status | Borrower | Loan Amount |
|---|---|---|---|
| Open | Aronne Alexis | $172,161 | |
| Previous Owner | Johnston Debra R | $161,555 | |
| Previous Owner | Johnston Debra R | $164,800 | |
| Previous Owner | Johnston Debra R | $94,090 |
Source: Public Records
Tax History Compared to Growth
Tax History
| Year | Tax Paid | Tax Assessment Tax Assessment Total Assessment is a certain percentage of the fair market value that is determined by local assessors to be the total taxable value of land and additions on the property. | Land | Improvement |
|---|---|---|---|---|
| 2025 | $3,555 | $105,520 | $0 | $105,520 |
| 2024 | $3,370 | $105,520 | $0 | $105,520 |
| 2023 | $3,170 | $105,520 | $0 | $105,520 |
| 2022 | $3,313 | $88,300 | $0 | $88,300 |
| 2021 | $3,305 | $88,300 | $0 | $88,300 |
| 2020 | $3,310 | $88,300 | $0 | $88,300 |
| 2019 | $3,327 | $88,300 | $0 | $88,300 |
| 2018 | $3,209 | $88,300 | $0 | $88,300 |
| 2017 | $3,138 | $88,510 | $0 | $88,510 |
| 2016 | $3,077 | $88,510 | $0 | $88,510 |
| 2015 | $3,011 | $88,510 | $0 | $88,510 |
| 2014 | $3,012 | $88,510 | $0 | $88,510 |
Source: Public Records
Map
Nearby Homes
- 170 Trolley Crossing Ln Unit 170
- 55 Trolley Crossing Ln Unit 55
- 107 Cambridge Commons Unit 107
- 206 Cambridge Commons Unit 206
- 123 Burgundy Hill Ln
- 56 Burgundy Hill Ln Unit 56
- 11 Little River Ln
- 52 Rising Trail Dr
- 36 Rising Trail Dr Unit 36
- 162 Rising Trail Dr
- 6 Coles Rd
- 101 Morning Glory Dr
- 91C Country Squire Dr Unit 91C
- 15 G Country Squire Dr Unit 15G
- 37 Coles Rd
- 30 Glenview Dr Unit 30
- 78 Rolling Green
- 15 Clubhouse Dr Unit 15
- 102 Greenview Terrace
- 142 Greenview Terrace
- 79 Trolley Crossing Ln
- 81 Trolley Crossing Ln
- 87 Trolley Crossing Ln
- 87 Trolley Crossing Ln Unit 87
- 77 Trolley Crossing Ln
- 77 Trolley Crossing Ln Unit 77
- 149 Trolley Crossing Ln Unit 149
- 89 Trolley Crossing Ln
- 85 Trolley Crossing Ln
- 85 Trolley Crossing Ln Unit 85
- 91 Trolley Crossing Ln
- 91 Trolley Crossing Ln Unit 91
- 83 Trolley Crossing Ln
- 83 Trolley Crossing Ln Unit 83
- 19 Trolley Crossing Ln
- 4 Trolley Crossing Ln
- 98 Trolley Crossing Ln
- 123 Trolley Crossing Ln
- 21 Trolley Crossing Ln
- 175 Trolley Crossing Ln