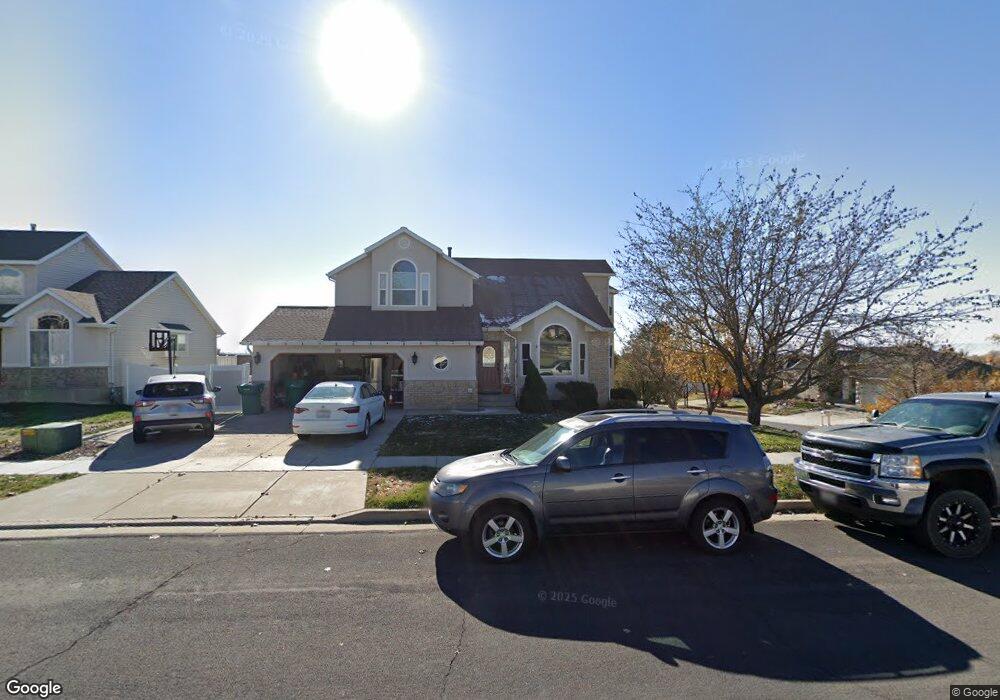
149 W 2300 N Clearfield, UT 84015
Estimated Value: $347,000 - $381,000
4
Beds
1
Bath
2,250
Sq Ft
$165/Sq Ft
Est. Value
About This Home
This home is located at 149 W 2300 N, Clearfield, UT 84015 and is currently estimated at $370,728, approximately $164 per square foot. 149 W 2300 N is a home located in Davis County with nearby schools including Sunset School, Sunset Junior High School, and Northridge High School.
Ownership History
Date
Name
Owned For
Owner Type
Purchase Details
Closed on
Aug 24, 2021
Sold by
Spackman Paul J and Estate Of Kathryn B Spackman
Bought by
Jones Nathan
Current Estimated Value
Home Financials for this Owner
Home Financials are based on the most recent Mortgage that was taken out on this home.
Original Mortgage
$242,000
Outstanding Balance
$220,053
Interest Rate
2.9%
Mortgage Type
New Conventional
Estimated Equity
$150,675
Purchase Details
Closed on
Aug 23, 2021
Sold by
Jones Nathan
Bought by
Jones Nathan and Jones Kimberly Rac
Home Financials for this Owner
Home Financials are based on the most recent Mortgage that was taken out on this home.
Original Mortgage
$242,000
Outstanding Balance
$220,053
Interest Rate
2.9%
Mortgage Type
New Conventional
Estimated Equity
$150,675
Purchase Details
Closed on
Mar 11, 1999
Sold by
Spackman Kathryn B and Spackman Farrell H
Bought by
Spackman Kathryn B
Create a Home Valuation Report for This Property
The Home Valuation Report is an in-depth analysis detailing your home's value as well as a comparison with similar homes in the area
Home Values in the Area
Average Home Value in this Area
Purchase History
| Date | Buyer | Sale Price | Title Company |
|---|---|---|---|
| Jones Nathan | -- | Metro National Title | |
| Jones Nathan | -- | Accommodation | |
| Spackman Kathryn B | -- | Avis & Archibald Title |
Source: Public Records
Mortgage History
| Date | Status | Borrower | Loan Amount |
|---|---|---|---|
| Open | Jones Nathan | $242,000 | |
| Closed | Jones Nathan | $242,000 |
Source: Public Records
Tax History Compared to Growth
Tax History
| Year | Tax Paid | Tax Assessment Tax Assessment Total Assessment is a certain percentage of the fair market value that is determined by local assessors to be the total taxable value of land and additions on the property. | Land | Improvement |
|---|---|---|---|---|
| 2025 | $2,026 | $184,800 | $61,333 | $123,467 |
| 2024 | $1,965 | $179,300 | $58,611 | $120,689 |
| 2023 | $1,840 | $306,000 | $116,798 | $189,202 |
| 2022 | $1,979 | $178,200 | $66,569 | $111,631 |
| 2021 | $1,492 | $232,000 | $72,922 | $159,078 |
| 2020 | $1,430 | $199,000 | $61,753 | $137,247 |
| 2019 | $203 | $193,000 | $76,472 | $116,528 |
| 2018 | $1,195 | $167,000 | $61,112 | $105,888 |
| 2016 | $1,012 | $72,655 | $28,905 | $43,750 |
| 2015 | $1,041 | $70,840 | $28,905 | $41,935 |
| 2014 | $926 | $64,384 | $28,905 | $35,479 |
| 2013 | -- | $68,484 | $23,265 | $45,219 |
Source: Public Records
Map
Nearby Homes
- 2101 N Main St Unit 205
- 2101 N Main St Unit 409
- 2085 N Main St Unit 409
- 2085 N Main St Unit 108
- 2085 N Main St Unit 401
- 2085 N Main St Unit 308
- 2085 N Main St Unit 116
- 2085 N Main St Unit 201
- 2085 N Main St Unit 402
- 2085 N Main St Unit 202
- 2085 N Main St Unit 301
- 2085 N Main St Unit 302
- 2085 N Main St Unit 115
- 52 W 2000 N
- 244 W 2575 N
- 1974 N 75 W
- 2616 2125 W
- 2177 N 450 W
- 2622 N 175 W
- 2622 2125 W