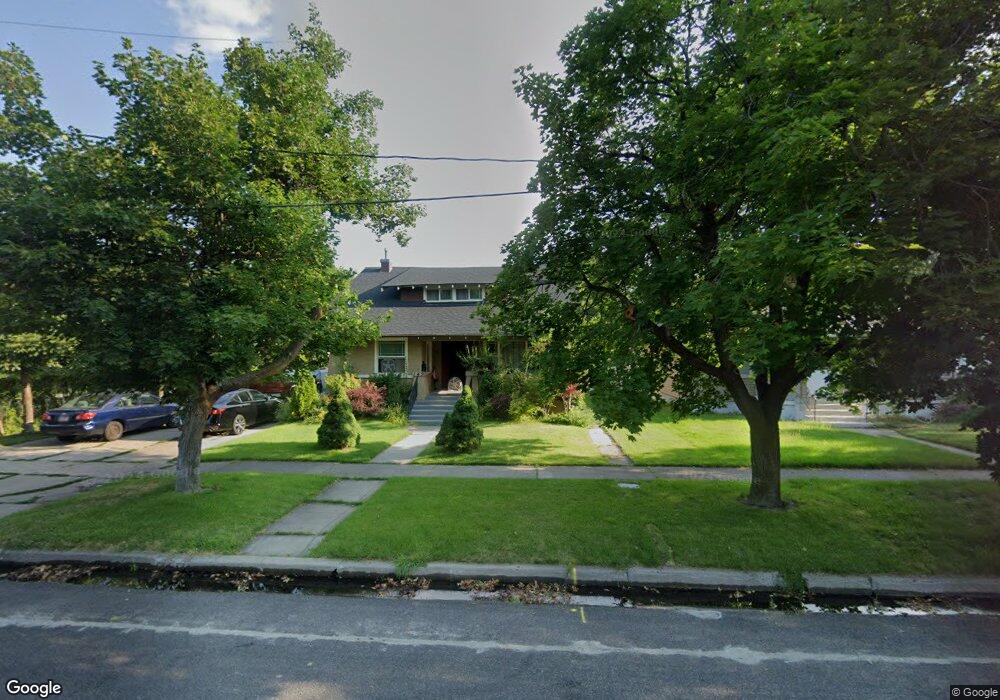
149 W 300 N Logan, UT 84321
Ellis NeighborhoodEstimated Value: $393,000 - $495,000
6
Beds
4
Baths
2,888
Sq Ft
$151/Sq Ft
Est. Value
About This Home
This home is located at 149 W 300 N, Logan, UT 84321 and is currently estimated at $435,078, approximately $150 per square foot. 149 W 300 N is a home located in Cache County with nearby schools including Ellis School, Mount Logan Middle School, and Logan High School.
Ownership History
Date
Name
Owned For
Owner Type
Purchase Details
Closed on
Mar 21, 2022
Sold by
Eric Astel
Bought by
Astel Eric and Astel Jennifer
Current Estimated Value
Purchase Details
Closed on
Jun 30, 2015
Sold by
Murray Blaine and Muray Dawn
Bought by
Astel Eric
Home Financials for this Owner
Home Financials are based on the most recent Mortgage that was taken out on this home.
Original Mortgage
$139,500
Interest Rate
3.81%
Mortgage Type
New Conventional
Purchase Details
Closed on
Jun 4, 2007
Sold by
Rivera Roberto
Bought by
Murray Blaine and Murray Dawn
Home Financials for this Owner
Home Financials are based on the most recent Mortgage that was taken out on this home.
Original Mortgage
$132,500
Interest Rate
6.14%
Mortgage Type
Purchase Money Mortgage
Create a Home Valuation Report for This Property
The Home Valuation Report is an in-depth analysis detailing your home's value as well as a comparison with similar homes in the area
Home Values in the Area
Average Home Value in this Area
Purchase History
| Date | Buyer | Sale Price | Title Company |
|---|---|---|---|
| Astel Eric | -- | Advanced Title | |
| Astel Eric | -- | Advanced Title | |
| Murray Blaine | -- | Cache Title Company |
Source: Public Records
Mortgage History
| Date | Status | Borrower | Loan Amount |
|---|---|---|---|
| Previous Owner | Astel Eric | $139,500 | |
| Previous Owner | Murray Blaine | $132,500 |
Source: Public Records
Tax History
| Year | Tax Paid | Tax Assessment Tax Assessment Total Assessment is a certain percentage of the fair market value that is determined by local assessors to be the total taxable value of land and additions on the property. | Land | Improvement |
|---|---|---|---|---|
| 2025 | $1,596 | $206,355 | $0 | $0 |
| 2024 | $164 | $205,675 | $0 | $0 |
| 2023 | $1,718 | $205,125 | $0 | $0 |
| 2022 | $179 | $199,275 | $0 | $0 |
| 2021 | $1,414 | $243,656 | $42,000 | $201,656 |
| 2020 | $1,271 | $197,120 | $42,000 | $155,120 |
| 2019 | $1,329 | $197,120 | $42,000 | $155,120 |
| 2018 | $1,333 | $180,500 | $42,000 | $138,500 |
| 2017 | $1,275 | $91,300 | $0 | $0 |
| 2016 | $1,322 | $85,800 | $0 | $0 |
| 2015 | $1,244 | $85,800 | $0 | $0 |
| 2014 | $943 | $71,995 | $0 | $0 |
| 2013 | -- | $71,995 | $0 | $0 |
Source: Public Records
Map
Nearby Homes
Your Personal Tour Guide
Ask me questions while you tour the home.