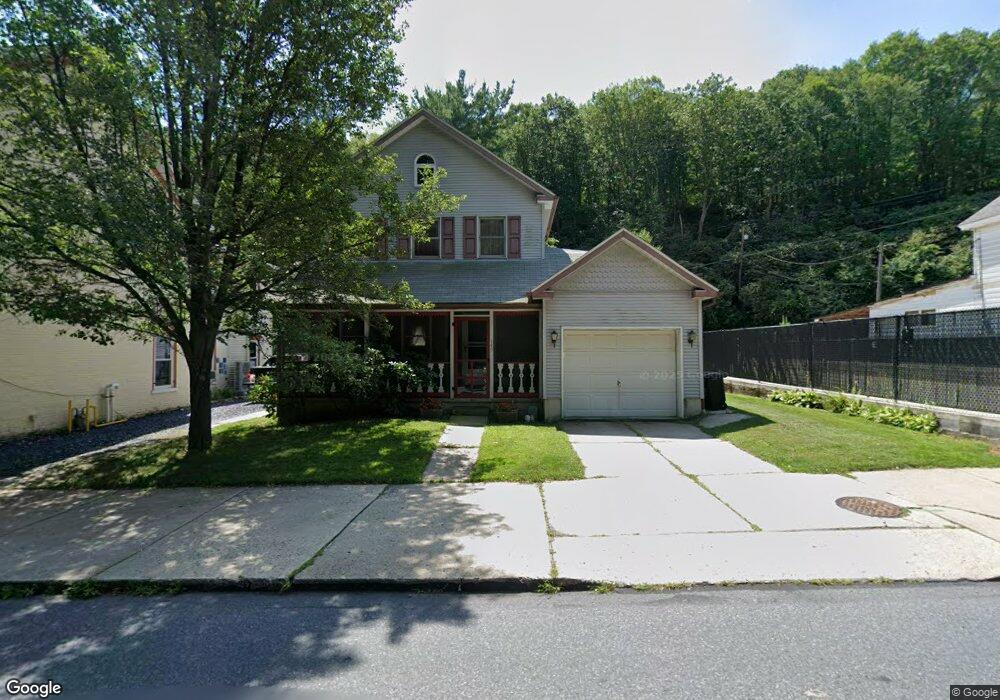
149 W Broadway Jim Thorpe, PA 18229
Estimated Value: $220,000 - $360,000
3
Beds
2
Baths
1,422
Sq Ft
$197/Sq Ft
Est. Value
About This Home
This home is located at 149 W Broadway, Jim Thorpe, PA 18229 and is currently estimated at $279,564, approximately $196 per square foot. 149 W Broadway is a home located in Carbon County with nearby schools including Jim Thorpe Area High School and Sts. Peter & Paul School.
Ownership History
Date
Name
Owned For
Owner Type
Purchase Details
Closed on
Jun 26, 2007
Sold by
Dulcey Stephen A and Dulcey Kamila A
Bought by
Brogan Thomas R
Current Estimated Value
Purchase Details
Closed on
Aug 11, 2005
Sold by
Corkill Anna D
Bought by
Dulcey Stephen A and Dulcey Kamila A
Home Financials for this Owner
Home Financials are based on the most recent Mortgage that was taken out on this home.
Original Mortgage
$124,000
Interest Rate
5.54%
Mortgage Type
New Conventional
Create a Home Valuation Report for This Property
The Home Valuation Report is an in-depth analysis detailing your home's value as well as a comparison with similar homes in the area
Home Values in the Area
Average Home Value in this Area
Purchase History
| Date | Buyer | Sale Price | Title Company |
|---|---|---|---|
| Brogan Thomas R | $170,000 | None Available | |
| Dulcey Stephen A | $155,000 | None Available |
Source: Public Records
Mortgage History
| Date | Status | Borrower | Loan Amount |
|---|---|---|---|
| Previous Owner | Dulcey Stephen A | $124,000 |
Source: Public Records
Tax History Compared to Growth
Tax History
| Year | Tax Paid | Tax Assessment Tax Assessment Total Assessment is a certain percentage of the fair market value that is determined by local assessors to be the total taxable value of land and additions on the property. | Land | Improvement |
|---|---|---|---|---|
| 2025 | $3,627 | $45,700 | $14,100 | $31,600 |
| 2024 | $3,490 | $45,700 | $14,100 | $31,600 |
| 2023 | $3,427 | $45,700 | $14,100 | $31,600 |
| 2022 | $3,372 | $45,700 | $14,100 | $31,600 |
| 2021 | $3,372 | $45,700 | $14,100 | $31,600 |
| 2020 | $3,255 | $45,700 | $14,100 | $31,600 |
| 2019 | $3,163 | $45,700 | $14,100 | $31,600 |
| 2018 | $3,093 | $45,700 | $14,100 | $31,600 |
| 2017 | $3,001 | $45,700 | $14,100 | $31,600 |
| 2016 | -- | $45,700 | $14,100 | $31,600 |
| 2015 | -- | $45,700 | $14,100 | $31,600 |
| 2014 | -- | $45,700 | $14,100 | $31,600 |
Source: Public Records
Map
Nearby Homes
- 131 W Broadway
- 622 Center Ave
- 732 Center Ave
- 65 Race St
- 223 North Ave
- 23-25 Race St
- 23 Race St
- 118 South Ave
- 0 N Dr Unit PM-116531
- 95 Center Ave
- A591 Apple Lane & Stony Mountain
- 59 W Front St
- 11 E Front St
- 115 Center St
- 218 Center St
- 226 Fern St
- 15 W 5th St Unit 17
- 432 Center St
- 431 South St
- 515 North St