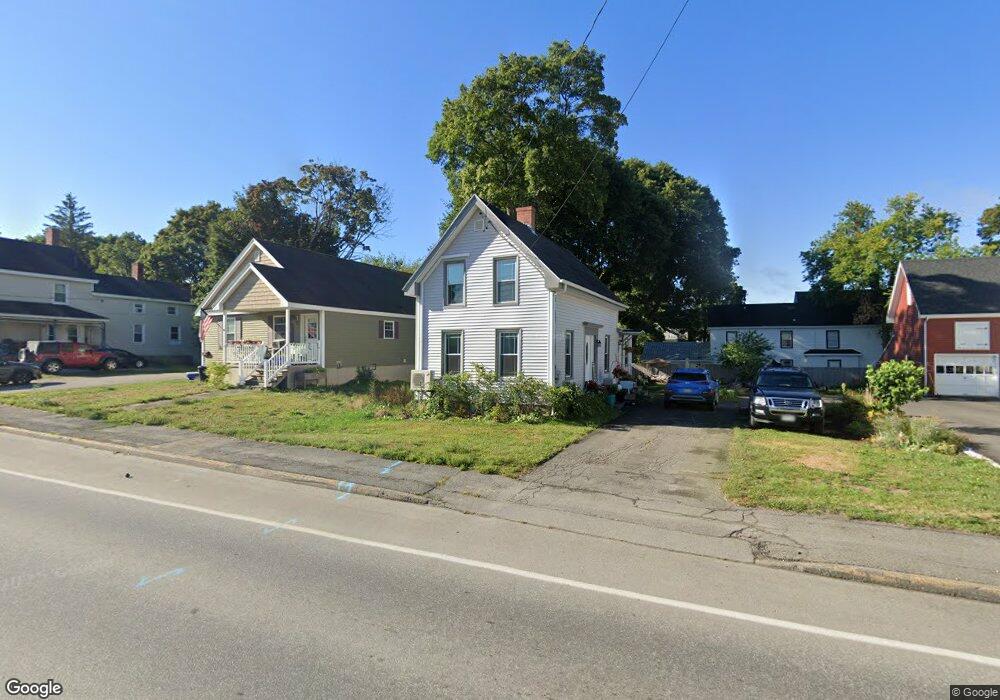
149 Wilson St Brewer, ME 04412
Estimated Value: $148,000 - $228,000
3
Beds
1
Bath
912
Sq Ft
$205/Sq Ft
Est. Value
About This Home
This home is located at 149 Wilson St, Brewer, ME 04412 and is currently estimated at $187,061, approximately $205 per square foot. 149 Wilson St is a home located in Penobscot County with nearby schools including Brewer Community School, Brewer High School, and All Saints Catholic School St. Mary's campus PreK-3.
Ownership History
Date
Name
Owned For
Owner Type
Purchase Details
Closed on
May 12, 2020
Sold by
Bankston Allison H
Bought by
Mayo Kimberley
Current Estimated Value
Home Financials for this Owner
Home Financials are based on the most recent Mortgage that was taken out on this home.
Original Mortgage
$98,228
Outstanding Balance
$86,084
Interest Rate
3.3%
Mortgage Type
New Conventional
Estimated Equity
$100,977
Create a Home Valuation Report for This Property
The Home Valuation Report is an in-depth analysis detailing your home's value as well as a comparison with similar homes in the area
Home Values in the Area
Average Home Value in this Area
Purchase History
| Date | Buyer | Sale Price | Title Company |
|---|---|---|---|
| Mayo Kimberley | -- | None Available | |
| Mayo Kimberley | -- | None Available |
Source: Public Records
Mortgage History
| Date | Status | Borrower | Loan Amount |
|---|---|---|---|
| Open | Mayo Kimberley | $98,228 | |
| Closed | Mayo Kimberley | $98,228 |
Source: Public Records
Tax History
| Year | Tax Paid | Tax Assessment Tax Assessment Total Assessment is a certain percentage of the fair market value that is determined by local assessors to be the total taxable value of land and additions on the property. | Land | Improvement |
|---|---|---|---|---|
| 2024 | $1,950 | $103,700 | $23,900 | $79,800 |
| 2023 | $1,843 | $91,700 | $22,200 | $69,500 |
| 2021 | $1,771 | $79,400 | $22,000 | $57,400 |
| 2020 | $1,654 | $79,400 | $22,000 | $57,400 |
| 2019 | $1,437 | $72,700 | $22,000 | $50,700 |
| 2018 | $1,376 | $62,500 | $22,000 | $40,500 |
| 2017 | $1,406 | $62,500 | $22,000 | $40,500 |
| 2016 | $1,345 | $62,500 | $22,000 | $40,500 |
| 2015 | $1,345 | $62,500 | $22,000 | $40,500 |
| 2014 | $1,308 | $62,500 | $22,000 | $40,500 |
| 2013 | $1,508 | $72,100 | $13,200 | $58,900 |
Source: Public Records
Map
Nearby Homes
Your Personal Tour Guide
Ask me questions while you tour the home.