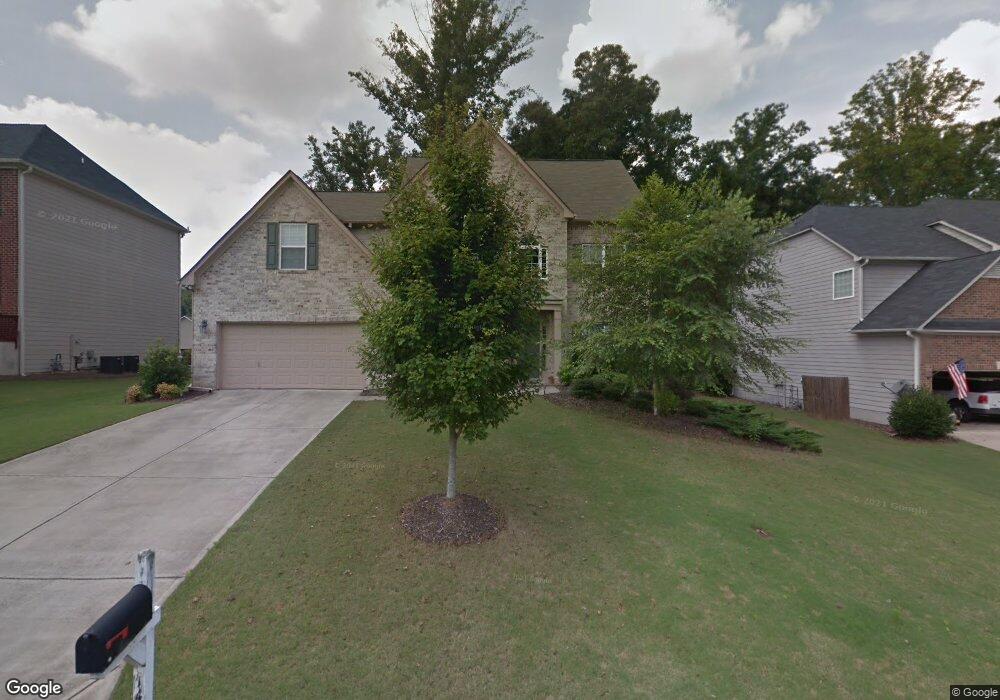
1490 Mystic Ridge Place Cumming, GA 30040
Estimated Value: $606,000 - $721,000
5
Beds
4
Baths
4,065
Sq Ft
$161/Sq Ft
Est. Value
About This Home
This home is located at 1490 Mystic Ridge Place, Cumming, GA 30040 and is currently estimated at $652,819, approximately $160 per square foot. 1490 Mystic Ridge Place is a home located in Forsyth County with nearby schools including Kelly Mill Elementary School, Hendricks Middle School, and Forsyth Central High School.
Ownership History
Date
Name
Owned For
Owner Type
Purchase Details
Closed on
Jul 16, 2009
Sold by
Gupta Ravindra
Bought by
Gupta Ravindra and Goyal Kavita
Current Estimated Value
Home Financials for this Owner
Home Financials are based on the most recent Mortgage that was taken out on this home.
Original Mortgage
$214,155
Outstanding Balance
$141,326
Interest Rate
5.53%
Mortgage Type
New Conventional
Estimated Equity
$511,493
Purchase Details
Closed on
Apr 7, 2009
Sold by
Juste Jean R
Bought by
Jpmorgan Chase Bank Na
Purchase Details
Closed on
Feb 20, 2007
Sold by
Mccar Homes Inc
Bought by
Juste Jean R
Home Financials for this Owner
Home Financials are based on the most recent Mortgage that was taken out on this home.
Original Mortgage
$317,700
Interest Rate
2.25%
Mortgage Type
New Conventional
Create a Home Valuation Report for This Property
The Home Valuation Report is an in-depth analysis detailing your home's value as well as a comparison with similar homes in the area
Home Values in the Area
Average Home Value in this Area
Purchase History
| Date | Buyer | Sale Price | Title Company |
|---|---|---|---|
| Gupta Ravindra | -- | -- | |
| Gupta Ravindra N | $238,000 | -- | |
| Jpmorgan Chase Bank Na | $281,038 | -- | |
| Juste Jean R | $353,700 | -- |
Source: Public Records
Mortgage History
| Date | Status | Borrower | Loan Amount |
|---|---|---|---|
| Open | Gupta Ravindra N | $214,155 | |
| Previous Owner | Juste Jean R | $317,700 |
Source: Public Records
Tax History Compared to Growth
Tax History
| Year | Tax Paid | Tax Assessment Tax Assessment Total Assessment is a certain percentage of the fair market value that is determined by local assessors to be the total taxable value of land and additions on the property. | Land | Improvement |
|---|---|---|---|---|
| 2025 | $5,083 | $250,128 | $74,000 | $176,128 |
| 2024 | $5,083 | $248,212 | $68,000 | $180,212 |
| 2023 | $4,299 | $222,728 | $60,000 | $162,728 |
| 2022 | $4,301 | $150,264 | $40,000 | $110,264 |
| 2021 | $3,868 | $150,264 | $40,000 | $110,264 |
| 2020 | $3,766 | $145,356 | $40,000 | $105,356 |
| 2019 | $3,552 | $134,692 | $26,000 | $108,692 |
| 2018 | $3,826 | $147,388 | $26,000 | $121,388 |
| 2017 | $3,534 | $132,876 | $28,000 | $104,876 |
| 2016 | $3,550 | $133,636 | $20,000 | $113,636 |
| 2015 | $3,360 | $124,396 | $20,000 | $104,396 |
| 2014 | $2,885 | $112,252 | $20,000 | $92,252 |
Source: Public Records
Map
Nearby Homes
- 1930 Stardust Trail
- 1280 Hidden Creek Point
- 1755 Dawn Valley Trail
- 3995 Village Estates Ct
- 4010 Village Estates Ct
- 4835 White Blossom Ct
- 5540 Castlebrooke Glen Ct
- 3428 Castleberry Village Cir Unit 47
- 5540 Keithwood Ct
- 516 Kelly Mill Rd
- 516 Kelly Mill Rd Unit LAND
- 517 Kelly Mill Rd
- 3680 Castleberry Rd
- 825 Mill Garden Place
- 3760 Castleberry Rd
- 3554 Castleberry Rd
- 4540 Natchez Ln
- 3815 Castleberry Rd
- 3315 Castleberry Rd
- 3215 Trowbridge Dr
- 1480 Mystic Ridge Place
- 1485 Mystic Ridge Place
- 1510 Mystic Ridge Place
- 1480 Mystic
- 1495 Mystic Ridge Place
- 1475 Mystic Ridge Place
- 1585 Nightfall Ct
- 1615 Nightfall Ct
- 1575 Nightfall Ct
- 0 Nightfall Ct Unit 8641583
- 0 Nightfall Ct Unit 8412787
- 0 Nightfall Ct Unit 8412786
- 0 Nightfall Ct Unit 8292682
- 0 Nightfall Ct Unit 8609179
- 0 Nightfall Ct Unit 8339544
- 0 Nightfall Ct Unit 8780401
- 0 Nightfall Ct Unit 3134165
- 0 Nightfall Ct Unit 7165380
- 0 Nightfall Ct Unit 7262539
- 0 Nightfall Ct Unit 7481097