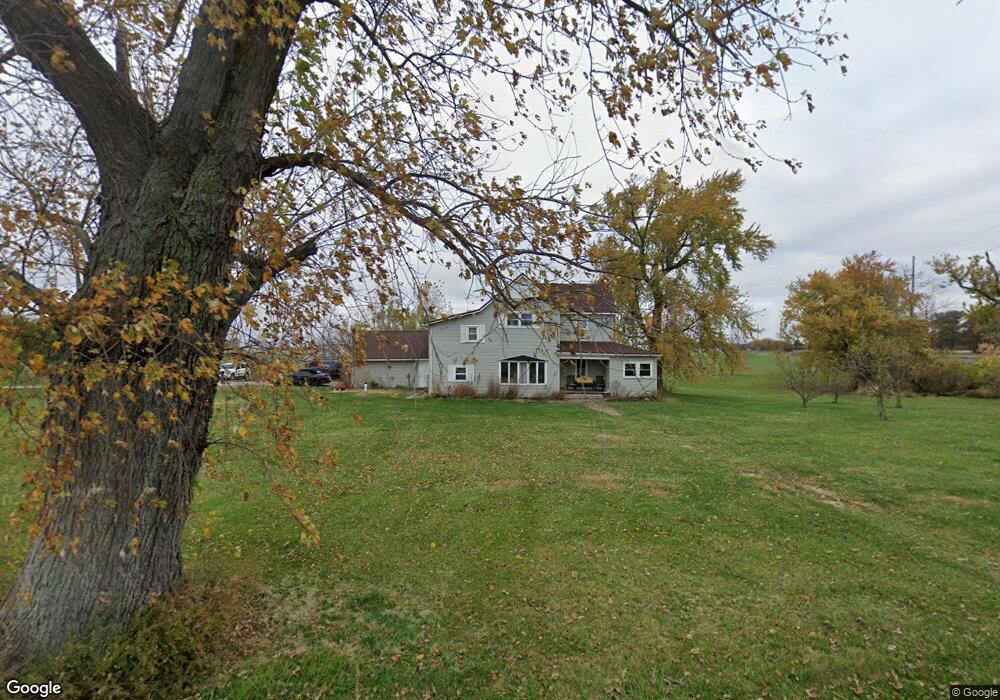
14901 Wapakoneta Buckland Rd Wapakoneta, OH 45895
Estimated Value: $128,000 - $403,000
3
Beds
2
Baths
2,448
Sq Ft
$99/Sq Ft
Est. Value
About This Home
This home is located at 14901 Wapakoneta Buckland Rd, Wapakoneta, OH 45895 and is currently estimated at $243,380, approximately $99 per square foot. 14901 Wapakoneta Buckland Rd is a home located in Auglaize County with nearby schools including Cridersville Elementary School, Wapakoneta High School, and Wapakoneta Middle School.
Ownership History
Date
Name
Owned For
Owner Type
Purchase Details
Closed on
Oct 11, 2012
Sold by
Benfield Steven W and Benfield Pamela R
Bought by
Bradford Amy M and Bradford Jason M
Current Estimated Value
Home Financials for this Owner
Home Financials are based on the most recent Mortgage that was taken out on this home.
Original Mortgage
$64,865
Outstanding Balance
$44,363
Interest Rate
3.25%
Mortgage Type
FHA
Estimated Equity
$199,017
Purchase Details
Closed on
Aug 5, 2010
Sold by
Federal Home Loan Mortgage Corporation
Bought by
Benfield Steven W and Benfield Pamela R
Purchase Details
Closed on
Jun 1, 2010
Sold by
Margraves Alan E
Bought by
Federal Home Loan Mortgage Corp
Purchase Details
Closed on
Dec 23, 1998
Sold by
Jones Clayton
Bought by
Margraves Alan E
Purchase Details
Closed on
Aug 1, 1990
Create a Home Valuation Report for This Property
The Home Valuation Report is an in-depth analysis detailing your home's value as well as a comparison with similar homes in the area
Home Values in the Area
Average Home Value in this Area
Purchase History
| Date | Buyer | Sale Price | Title Company |
|---|---|---|---|
| Bradford Amy M | $75,000 | Attorney | |
| Benfield Steven W | $51,266 | None Available | |
| Federal Home Loan Mortgage Corp | $69,000 | None Available | |
| Margraves Alan E | $90,500 | -- | |
| -- | $70,000 | -- |
Source: Public Records
Mortgage History
| Date | Status | Borrower | Loan Amount |
|---|---|---|---|
| Open | Bradford Amy M | $64,865 |
Source: Public Records
Tax History Compared to Growth
Tax History
| Year | Tax Paid | Tax Assessment Tax Assessment Total Assessment is a certain percentage of the fair market value that is determined by local assessors to be the total taxable value of land and additions on the property. | Land | Improvement |
|---|---|---|---|---|
| 2024 | $3,205 | $64,420 | $17,170 | $47,250 |
| 2023 | $2,157 | $64,420 | $17,170 | $47,250 |
| 2022 | $1,706 | $46,560 | $14,320 | $32,240 |
| 2021 | $1,684 | $46,560 | $14,320 | $32,240 |
| 2020 | $853 | $46,550 | $14,315 | $32,235 |
| 2019 | $1,439 | $38,154 | $11,732 | $26,422 |
| 2018 | $1,443 | $38,154 | $11,732 | $26,422 |
| 2017 | $1,434 | $38,154 | $11,732 | $26,422 |
| 2016 | $1,391 | $37,132 | $11,176 | $25,956 |
| 2015 | $1,419 | $37,132 | $11,176 | $25,956 |
| 2014 | $1,379 | $37,132 | $11,176 | $25,956 |
| 2013 | $1,416 | $37,132 | $11,176 | $25,956 |
Source: Public Records
Map
Nearby Homes
- 17092 Hauss Rd
- 109 Bluegrass Dr
- 0 Wapakoneta Cridersville Rd
- 17054 State Route 198
- 0 Ohio 67
- 310 W Main St
- 322 Cole Dr
- 420 Hoopengarner St
- 212 S Oak St
- 9 E Silver St
- 808 Aster Dr
- 920 Primrose Dr
- 906 Aster Dr
- 1028 Stonegate Ct
- 1020 Timber Trail
- 924 Poppy Dr
- 5290 New Haven Dr
- 307 W Auglaize St
- 201 E Pearl St
- 17768 Hauss Rd
- 14501 Wapakoneta Buckland Rd
- 18374 Hauss Rd
- 18390 Hauss Rd
- 18584 Hauss Rd
- 17470 Hauss Rd
- 17440 Hauss Rd
- 17567 County Road 25a
- 17555 County Road 25a
- 17465 County Road 25a
- 17509 County Road 25a
- 17589 County Road 25a
- 17346 Hauss Rd
- 17664 County Road 25a
- 17720 County Road 25a
- 17730 County Road 25a
- 17437 County Road 25a
- 17494 County Road 25a
- 17341 County Road 25a