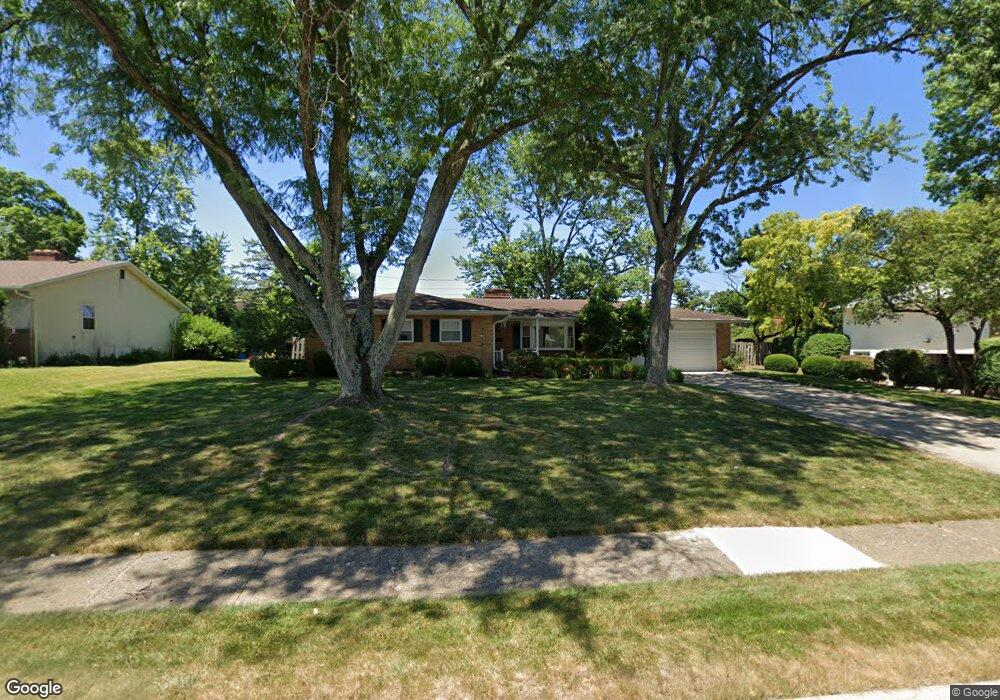
1491 Pemberton Dr Columbus, OH 43221
Estimated Value: $608,000 - $714,000
4
Beds
3
Baths
2,350
Sq Ft
$282/Sq Ft
Est. Value
About This Home
This home is located at 1491 Pemberton Dr, Columbus, OH 43221 and is currently estimated at $663,680, approximately $282 per square foot. 1491 Pemberton Dr is a home located in Franklin County with nearby schools including Greensview Elementary School, Hastings Middle School, and Upper Arlington High School.
Ownership History
Date
Name
Owned For
Owner Type
Purchase Details
Closed on
Sep 30, 2008
Sold by
Terebuh Victor and Terebuh Renee D
Bought by
Gloyd James R and Gloyd Christine K
Current Estimated Value
Home Financials for this Owner
Home Financials are based on the most recent Mortgage that was taken out on this home.
Original Mortgage
$45,000
Interest Rate
5.93%
Mortgage Type
Purchase Money Mortgage
Purchase Details
Closed on
Jun 29, 2000
Sold by
Hammer Peter C
Bought by
Terebuh Victor
Home Financials for this Owner
Home Financials are based on the most recent Mortgage that was taken out on this home.
Original Mortgage
$205,000
Interest Rate
8.64%
Purchase Details
Closed on
Oct 31, 1996
Sold by
Snyder Howard
Bought by
Peter C Hammar
Home Financials for this Owner
Home Financials are based on the most recent Mortgage that was taken out on this home.
Original Mortgage
$127,800
Interest Rate
7.75%
Mortgage Type
New Conventional
Create a Home Valuation Report for This Property
The Home Valuation Report is an in-depth analysis detailing your home's value as well as a comparison with similar homes in the area
Home Values in the Area
Average Home Value in this Area
Purchase History
| Date | Buyer | Sale Price | Title Company |
|---|---|---|---|
| Gloyd James R | $347,500 | Chicago Tit | |
| Terebuh Victor | $205,000 | -- | |
| Peter C Hammar | $142,000 | -- |
Source: Public Records
Mortgage History
| Date | Status | Borrower | Loan Amount |
|---|---|---|---|
| Closed | Gloyd James R | $45,000 | |
| Closed | Terebuh Victor | $205,000 | |
| Previous Owner | Peter C Hammar | $127,800 |
Source: Public Records
Tax History
| Year | Tax Paid | Tax Assessment Tax Assessment Total Assessment is a certain percentage of the fair market value that is determined by local assessors to be the total taxable value of land and additions on the property. | Land | Improvement |
|---|---|---|---|---|
| 2025 | $10,224 | $186,410 | $72,030 | $114,380 |
| 2024 | $10,224 | $186,410 | $72,030 | $114,380 |
| 2023 | $10,134 | $186,410 | $72,030 | $114,380 |
| 2022 | $9,059 | $138,390 | $51,310 | $87,080 |
| 2021 | $8,019 | $138,390 | $51,310 | $87,080 |
| 2020 | $7,948 | $138,390 | $51,310 | $87,080 |
| 2019 | $7,823 | $121,560 | $51,310 | $70,250 |
| 2018 | $7,234 | $121,560 | $51,310 | $70,250 |
| 2017 | $7,229 | $121,560 | $51,310 | $70,250 |
| 2016 | $6,695 | $110,010 | $34,690 | $75,320 |
| 2015 | $6,689 | $110,010 | $34,690 | $75,320 |
| 2014 | $6,697 | $110,010 | $34,690 | $75,320 |
| 2013 | $3,170 | $99,995 | $31,535 | $68,460 |
Source: Public Records
Map
Nearby Homes
- 1530 Pemberton Dr
- 1744 Ridgecliff Rd Unit 12
- 1379 La Rochelle Dr Unit 19C
- 3175 Tremont Rd Unit 313
- 1842 Ridgecliff Rd
- 1811 Hove Rd
- 3336 Mansion Way
- 3106 Somerford Rd
- 1065 Bernard Rd
- 3190 Kenny Rd
- 1068 Shady Hill Dr
- 1224 Kenbrook Hills Dr Unit 25
- 959 Caniff Place
- 2026 Jervis Rd
- 3701 Reed Rd
- 2227 Zollinger Rd
- 955 Amberly Place
- 1489 Westminster Dr
- 723 Drummond Ct
- 2748 Tremont Rd
- 1501 Pemberton Dr
- 1483 Pemberton Dr
- 1490 Pemberton Dr
- 1511 Pemberton Dr
- 1482 Pemberton Dr
- 1580 Fishinger Rd
- 1580 Fishinger Rd Unit 290
- 1570 Fishinger Rd Unit 102
- 1506 Pemberton Dr
- 1519 Pemberton Dr
- 1518 Fishinger Rd
- 1514 Pemberton Dr
- 3299 Abbey Rd
- 1600 Fishinger Rd
- 1563 Fishinger Rd
- 1575 Fishinger Rd
- 3311 Abbey Rd
- 1527 Pemberton Dr
- 1553 Fishinger Rd
- 1541 Fishinger Rd
Your Personal Tour Guide
Ask me questions while you tour the home.