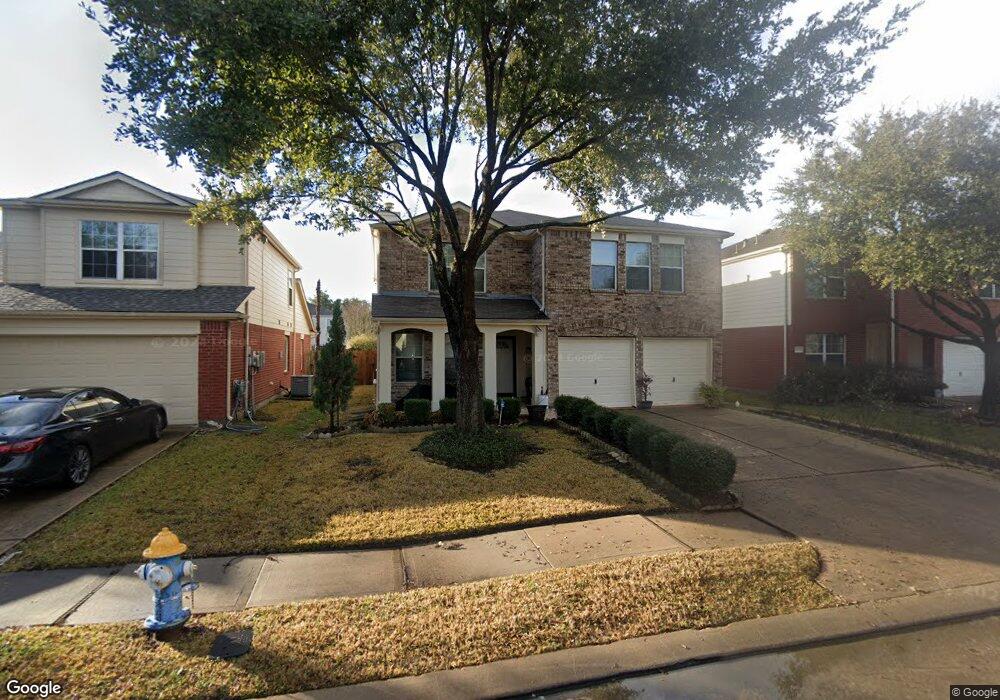
14911 Sugar Crystal Ct Sugar Land, TX 77498
Estimated Value: $311,274 - $331,000
--
Bed
1
Bath
2,371
Sq Ft
$137/Sq Ft
Est. Value
About This Home
This home is located at 14911 Sugar Crystal Ct, Sugar Land, TX 77498 and is currently estimated at $324,819, approximately $136 per square foot. 14911 Sugar Crystal Ct is a home located in Fort Bend County with nearby schools including Rita Drabek Elementary School, Sugar Land Middle School, and Kempner High School.
Ownership History
Date
Name
Owned For
Owner Type
Purchase Details
Closed on
Aug 30, 2024
Sold by
Quiblat Emilia and Mauleon Emilia
Bought by
Clark Maria Victoria Nic
Current Estimated Value
Home Financials for this Owner
Home Financials are based on the most recent Mortgage that was taken out on this home.
Original Mortgage
$241,250
Outstanding Balance
$238,694
Interest Rate
6.78%
Mortgage Type
New Conventional
Estimated Equity
$86,125
Purchase Details
Closed on
Dec 6, 2002
Sold by
Pulte Homes Of Texas Lp
Bought by
Mauleon Emilia
Home Financials for this Owner
Home Financials are based on the most recent Mortgage that was taken out on this home.
Original Mortgage
$139,922
Interest Rate
6.05%
Purchase Details
Closed on
Jun 13, 2002
Sold by
Skymark Dvmt Co Inc
Bought by
Quiblat Emilia
Purchase Details
Closed on
Apr 12, 2002
Sold by
Alderete Andrew
Bought by
Rios Rosa Linda and Orozco Maria Victoria
Create a Home Valuation Report for This Property
The Home Valuation Report is an in-depth analysis detailing your home's value as well as a comparison with similar homes in the area
Home Values in the Area
Average Home Value in this Area
Purchase History
| Date | Buyer | Sale Price | Title Company |
|---|---|---|---|
| Clark Maria Victoria Nic | -- | Fidelity National Title | |
| Mauleon Emilia | -- | First American Title | |
| Quiblat Emilia | -- | -- | |
| Quiblat Emilia | -- | -- | |
| Rios Rosa Linda | -- | -- |
Source: Public Records
Mortgage History
| Date | Status | Borrower | Loan Amount |
|---|---|---|---|
| Open | Clark Maria Victoria Nic | $241,250 | |
| Previous Owner | Quiblat Emilia | $139,922 |
Source: Public Records
Tax History Compared to Growth
Tax History
| Year | Tax Paid | Tax Assessment Tax Assessment Total Assessment is a certain percentage of the fair market value that is determined by local assessors to be the total taxable value of land and additions on the property. | Land | Improvement |
|---|---|---|---|---|
| 2025 | $4,137 | $315,663 | $45,760 | $269,903 |
| 2024 | $4,137 | $296,087 | $25,227 | $270,860 |
| 2023 | $3,732 | $269,170 | $0 | $279,342 |
| 2022 | $4,268 | $244,700 | $2,500 | $242,200 |
| 2021 | $5,012 | $222,450 | $32,000 | $190,450 |
| 2020 | $5,196 | $225,560 | $32,000 | $193,560 |
| 2019 | $4,987 | $205,830 | $32,000 | $173,830 |
| 2018 | $4,962 | $201,070 | $32,000 | $169,070 |
| 2017 | $4,870 | $190,760 | $32,000 | $158,760 |
| 2016 | $4,839 | $189,550 | $32,000 | $157,550 |
| 2015 | $2,755 | $172,320 | $32,000 | $140,320 |
| 2014 | $2,630 | $156,650 | $32,000 | $124,650 |
Source: Public Records
Map
Nearby Homes
- 14910 Sugar Crystal Ct
- 14934 Sugar Falls Ct
- 10326 Low Bridge Ln
- 14819 Alderwick Dr
- 15202 Old Richmond Rd
- 0 Old Richmond Rd
- 14927 Sugar Sweet Dr
- 21201 and 15622 2nd St
- 10622 Sugar Place Ct
- 14503 Hagans Ct
- 15111 Snow Hill Ct
- 15102 Millers Run Ln
- 10815 Ashland Bridge Ln
- 9911 Chalford Dr
- 16005 Old Richmond Rd
- 14315 Branchwater Ln
- 15527 Petitt Rd
- 14303 Branchwater Ln
- 10018 King Ranch Ln
- 15610 Ennis Rd
- 14907 Sugar Crystal Ct
- 14915 Sugar Crystal Ct
- 14919 Sugar Crystal Ct
- 14903 Sugar Crystal Ct
- 14910 Sugar Cup Ct
- 14906 Sugar Cup Ct
- 14914 Sugar Cup Ct
- 14923 Sugar Crystal Ct
- 14918 Sugar Cup Ct
- 14902 Sugar Cup Ct
- 14910 Sugar Crystal Ct Unit 2
- 14906 Sugar Crystal Ct
- 14914 Sugar Crystal Ct
- 14922 Sugar Cup Ct
- 14927 Sugar Crystal Ct
- 14902 Sugar Crystal Ct
- 14918 Sugar Crystal Ct
- 14922 Sugar Crystal Ct
- 14926 Sugar Cup Ct
- 14931 Sugar Crystal Ct