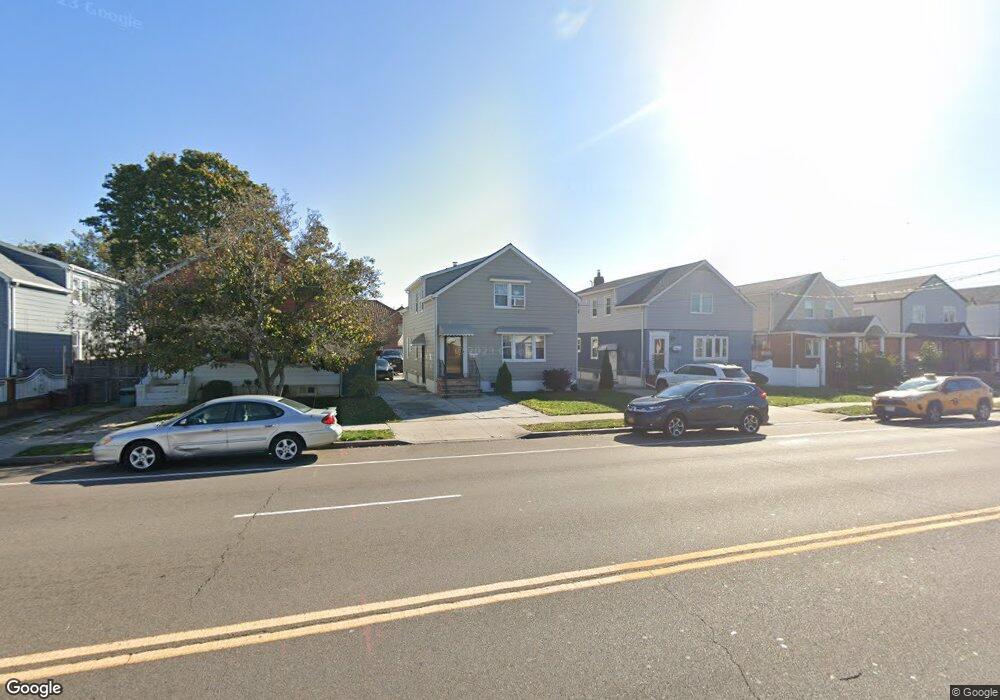
14915 Lefferts Blvd South Ozone Park, NY 11420
South Ozone Park NeighborhoodEstimated Value: $1,052,000 - $1,290,000
6
Beds
3
Baths
1,900
Sq Ft
$605/Sq Ft
Est. Value
About This Home
This home is located at 14915 Lefferts Blvd, South Ozone Park, NY 11420 and is currently estimated at $1,149,951, approximately $605 per square foot. 14915 Lefferts Blvd is a home located in Queens County with nearby schools including Ps 124 Osmond A Church, J.H.S. 226 Virgil I. Grisson, and John Adams High School.
Ownership History
Date
Name
Owned For
Owner Type
Purchase Details
Closed on
May 31, 2018
Sold by
Singh Ravinder J
Bought by
Parkash Dharam
Current Estimated Value
Home Financials for this Owner
Home Financials are based on the most recent Mortgage that was taken out on this home.
Original Mortgage
$474,000
Outstanding Balance
$409,931
Interest Rate
4.5%
Mortgage Type
New Conventional
Estimated Equity
$740,020
Purchase Details
Closed on
Dec 11, 2017
Sold by
Singh Tarlok
Bought by
Singh Ravinder J
Purchase Details
Closed on
Sep 16, 2009
Sold by
Corace Edith and Corace William V
Bought by
Singh Tarlok
Home Financials for this Owner
Home Financials are based on the most recent Mortgage that was taken out on this home.
Original Mortgage
$395,200
Interest Rate
5.14%
Mortgage Type
Purchase Money Mortgage
Purchase Details
Closed on
Mar 19, 1999
Sold by
Corace Edith and Nestico Filomena
Bought by
Corace Edith and Nestico Filomena
Create a Home Valuation Report for This Property
The Home Valuation Report is an in-depth analysis detailing your home's value as well as a comparison with similar homes in the area
Home Values in the Area
Average Home Value in this Area
Purchase History
| Date | Buyer | Sale Price | Title Company |
|---|---|---|---|
| Parkash Dharam | $790,000 | -- | |
| Parkash Dharam | $790,000 | -- | |
| Singh Ravinder J | -- | -- | |
| Singh Ravinder J | -- | -- | |
| Singh Tarlok | $499,999 | -- | |
| Singh Tarlok | $499,999 | -- | |
| Corace Edith | -- | Commonwealth Land Title Ins | |
| Corace Edith | -- | Commonwealth Land Title Ins |
Source: Public Records
Mortgage History
| Date | Status | Borrower | Loan Amount |
|---|---|---|---|
| Open | Parkash Dharam | $474,000 | |
| Closed | Parkash Dharam | $474,000 | |
| Previous Owner | Singh Tarlok | $395,200 |
Source: Public Records
Tax History Compared to Growth
Tax History
| Year | Tax Paid | Tax Assessment Tax Assessment Total Assessment is a certain percentage of the fair market value that is determined by local assessors to be the total taxable value of land and additions on the property. | Land | Improvement |
|---|---|---|---|---|
| 2025 | $8,990 | $45,101 | $7,324 | $37,777 |
| 2024 | $8,990 | $44,761 | $8,630 | $36,131 |
| 2023 | $8,481 | $42,228 | $7,271 | $34,957 |
| 2022 | $7,953 | $64,800 | $10,620 | $54,180 |
| 2021 | $7,910 | $53,700 | $10,620 | $43,080 |
| 2020 | $7,955 | $48,660 | $10,620 | $38,040 |
| 2019 | $7,803 | $49,260 | $10,620 | $38,640 |
| 2018 | $7,173 | $35,190 | $9,080 | $26,110 |
| 2017 | $6,468 | $33,199 | $9,729 | $23,470 |
| 2016 | $5,951 | $33,199 | $9,729 | $23,470 |
| 2015 | $3,876 | $32,220 | $11,820 | $20,400 |
| 2014 | $3,876 | $31,545 | $11,572 | $19,973 |
Source: Public Records
Map
Nearby Homes
- 12114 149th Ave
- 121-14 149 Ave
- 135-28 122nd St
- 12104 150th Ave
- 13512 122nd Place
- 13344 122nd St
- 150-24 117th St
- 11514 135th Ave
- 11512 135th Ave
- 133-24 118th St
- 135-56 124th St
- 133-50 123rd St
- 135-42 124th St
- 135-43 124th St
- 135-47 124th St
- 122-05 133rd Ave
- 149-27 114th St
- 130-55 116th St
- 12403 152nd Ave
- 13336 114th Place
- 14915 Lefferts Blvd
- 14911 Lefferts Blvd
- 14919 Lefferts Blvd
- 14919 Lefferts Blvd
- 14907 Lefferts Blvd
- 14923 Lefferts Blvd
- 14914 120th St
- 14918 120th St
- 11914 149th Ave Unit 11916
- 14927 Lefferts Blvd
- 14901 Lefferts Blvd
- 149-43 Lefferts Blvd
- 14922 120th St
- 11916 149th Ave
- 119-16 149th Ave
- 119-16 149th Ave
- 149-07 Lefferts Blvd
- 149-34 Lefferts Blvd
- 11920 149th Ave
- 14931 Lefferts Blvd