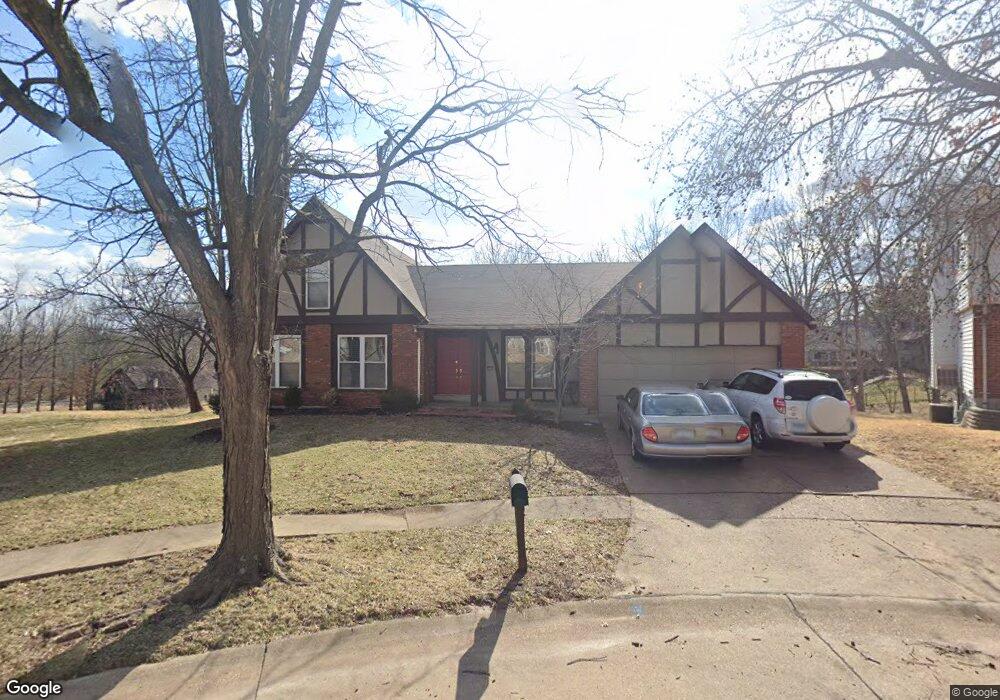
14916 Pocono Cir Chesterfield, MO 63017
Estimated Value: $503,000 - $538,000
5
Beds
3
Baths
2,683
Sq Ft
$195/Sq Ft
Est. Value
About This Home
This home is located at 14916 Pocono Cir, Chesterfield, MO 63017 and is currently estimated at $522,600, approximately $194 per square foot. 14916 Pocono Cir is a home located in St. Louis County with nearby schools including Shenandoah Valley Elementary, Parkway Central Middle School, and Parkway Central High School.
Ownership History
Date
Name
Owned For
Owner Type
Purchase Details
Closed on
Apr 14, 2008
Sold by
Turner Jost Dee A
Bought by
Jost Dee Ann
Current Estimated Value
Home Financials for this Owner
Home Financials are based on the most recent Mortgage that was taken out on this home.
Original Mortgage
$220,000
Outstanding Balance
$140,375
Interest Rate
6.11%
Mortgage Type
Stand Alone Refi Refinance Of Original Loan
Estimated Equity
$382,225
Purchase Details
Closed on
Oct 15, 2007
Sold by
Jost John C and Turner Jost Dee Ann
Bought by
Turner Jost Dee A
Home Financials for this Owner
Home Financials are based on the most recent Mortgage that was taken out on this home.
Original Mortgage
$220,000
Interest Rate
6.32%
Mortgage Type
Purchase Money Mortgage
Purchase Details
Closed on
Jan 30, 1998
Sold by
Abrams Sherwin J and Abrams Terry B
Bought by
Jost John C and Jost Dee Ann
Home Financials for this Owner
Home Financials are based on the most recent Mortgage that was taken out on this home.
Original Mortgage
$124,800
Interest Rate
6.98%
Create a Home Valuation Report for This Property
The Home Valuation Report is an in-depth analysis detailing your home's value as well as a comparison with similar homes in the area
Home Values in the Area
Average Home Value in this Area
Purchase History
| Date | Buyer | Sale Price | Title Company |
|---|---|---|---|
| Jost Dee Ann | -- | Integrity Land Title Co Inc | |
| Turner Jost Dee A | -- | None Available | |
| Jost John C | -- | -- |
Source: Public Records
Mortgage History
| Date | Status | Borrower | Loan Amount |
|---|---|---|---|
| Open | Jost Dee Ann | $220,000 | |
| Closed | Turner Jost Dee A | $220,000 | |
| Closed | Jost John C | $124,800 |
Source: Public Records
Tax History Compared to Growth
Tax History
| Year | Tax Paid | Tax Assessment Tax Assessment Total Assessment is a certain percentage of the fair market value that is determined by local assessors to be the total taxable value of land and additions on the property. | Land | Improvement |
|---|---|---|---|---|
| 2025 | $5,149 | $74,860 | $39,580 | $35,280 |
| 2024 | $5,149 | $77,830 | $21,950 | $55,880 |
| 2023 | $5,149 | $77,830 | $21,950 | $55,880 |
| 2022 | $4,746 | $68,060 | $21,950 | $46,110 |
| 2021 | $4,727 | $68,060 | $21,950 | $46,110 |
| 2020 | $4,236 | $58,540 | $19,000 | $39,540 |
| 2019 | $4,144 | $58,540 | $19,000 | $39,540 |
| 2018 | $4,162 | $54,530 | $19,000 | $35,530 |
| 2017 | $4,049 | $54,530 | $19,000 | $35,530 |
| 2016 | $4,193 | $53,680 | $14,120 | $39,560 |
| 2015 | $4,395 | $53,680 | $14,120 | $39,560 |
| 2014 | $3,816 | $49,800 | $10,300 | $39,500 |
Source: Public Records
Map
Nearby Homes
- 14616 Rogue River Dr
- 15261 Springrun Dr
- 1226 Luray Dr
- 14361 White Birch Valley Ln
- 1251 Still House Creek Rd
- 15324 Appalachian Trail
- 384 Greentrails Dr S
- 1237 Cedar Creek Rd
- 1123 Cabinview Ct
- 14560 White Birch Valley Ln
- 14424 Valley Meadow Ct W
- 1110 Nooning Tree Dr
- 240 Greentrails Dr S
- 445 Whitestone Farm Dr
- 14300 Conway Meadows Ct E Unit 302
- 14144 Baywood Villages Dr
- 14663 Mallard Lake Dr
- 14629 Timberlake Manor Ct
- 1507 Timberlake Manor Pkwy
- 314 Valley Forge Ct
- 14915 Pocono Cir
- 14922 Pocono Cir
- 14921 Pocono Cir
- 14930 Pocono Cir
- 14933 Appalachian Trail
- 14941 Appalachian Trail
- 14925 Appalachian Trail
- 14929 Pocono Cir
- 14949 Appalachian Trail
- 14917 Appalachian Trail
- 14942 Pocono Cir
- 14941 Pocono Cir
- 14957 Appalachian Trail
- 14778 Plumas Dr
- 14774 Plumas Dr
- 14909 Appalachian Trail
- 14782 Plumas Dr
- 14971 Appalachian Trail
- 14950 Pocono Cir
- 14947 Pocono Cir