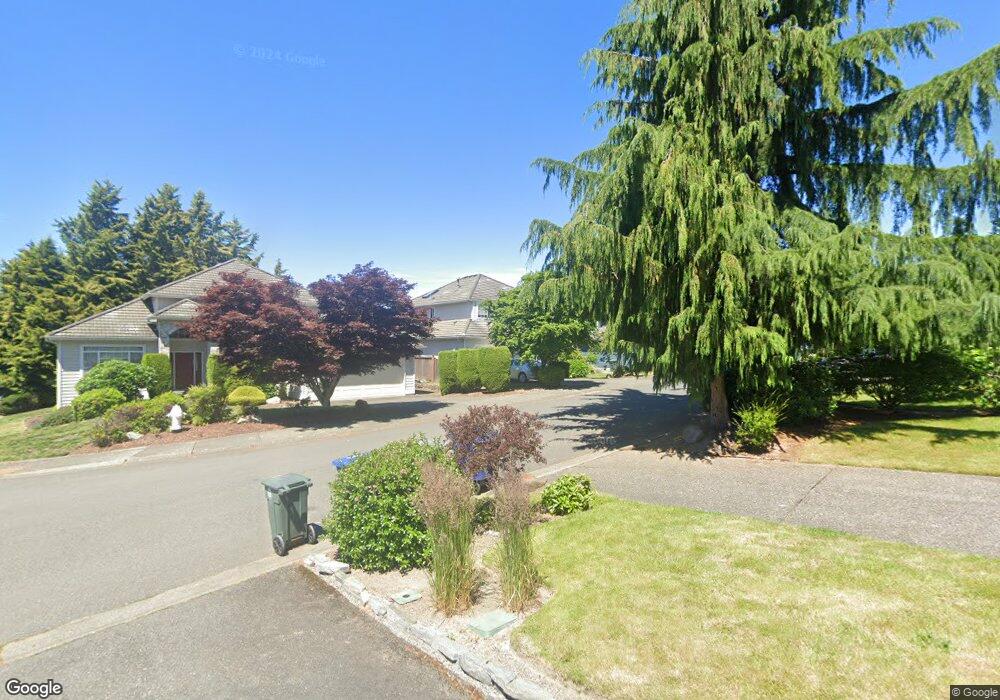
14919 89th Place NE Kenmore, WA 98028
Moorlands NeighborhoodEstimated Value: $1,153,000 - $1,214,000
3
Beds
3
Baths
2,010
Sq Ft
$587/Sq Ft
Est. Value
About This Home
This home is located at 14919 89th Place NE, Kenmore, WA 98028 and is currently estimated at $1,180,857, approximately $587 per square foot. 14919 89th Place NE is a home located in King County with nearby schools including Moorlands Elementary School, Northshore Junior High School, and Inglemoor High School.
Ownership History
Date
Name
Owned For
Owner Type
Purchase Details
Closed on
Jul 23, 2004
Sold by
Semon Keely L and Semon Trevor C
Bought by
Roberts Michael K and Roberts Theresa R
Current Estimated Value
Home Financials for this Owner
Home Financials are based on the most recent Mortgage that was taken out on this home.
Original Mortgage
$310,000
Outstanding Balance
$146,182
Interest Rate
5.37%
Mortgage Type
Purchase Money Mortgage
Estimated Equity
$1,034,675
Purchase Details
Closed on
Jan 25, 2002
Sold by
Mischel David P and Kamm Mischel Lisa K
Bought by
Semon Keely L and Semon Trevor C
Home Financials for this Owner
Home Financials are based on the most recent Mortgage that was taken out on this home.
Original Mortgage
$150,000
Interest Rate
6.59%
Purchase Details
Closed on
Aug 12, 1993
Sold by
Eckert Daniel L and Eckert Susan
Bought by
Mischel David P
Purchase Details
Closed on
Nov 10, 1992
Sold by
Tait James W and Tait Susan L
Bought by
Eckert Daniel L and Eckert Susan A
Create a Home Valuation Report for This Property
The Home Valuation Report is an in-depth analysis detailing your home's value as well as a comparison with similar homes in the area
Home Values in the Area
Average Home Value in this Area
Purchase History
| Date | Buyer | Sale Price | Title Company |
|---|---|---|---|
| Roberts Michael K | $387,500 | Stewart Title | |
| Semon Keely L | $313,500 | First American | |
| Mischel David P | $212,000 | -- | |
| Eckert Daniel L | $120,000 | -- |
Source: Public Records
Mortgage History
| Date | Status | Borrower | Loan Amount |
|---|---|---|---|
| Open | Roberts Michael K | $310,000 | |
| Previous Owner | Semon Keely L | $150,000 |
Source: Public Records
Tax History Compared to Growth
Tax History
| Year | Tax Paid | Tax Assessment Tax Assessment Total Assessment is a certain percentage of the fair market value that is determined by local assessors to be the total taxable value of land and additions on the property. | Land | Improvement |
|---|---|---|---|---|
| 2024 | $10,580 | $1,049,000 | $452,000 | $597,000 |
| 2023 | $10,138 | $899,000 | $369,000 | $530,000 |
| 2022 | $9,101 | $1,126,000 | $440,000 | $686,000 |
| 2021 | $8,392 | $821,000 | $320,000 | $501,000 |
| 2020 | $8,318 | $692,000 | $265,000 | $427,000 |
| 2018 | $6,266 | $562,000 | $233,000 | $329,000 |
| 2017 | $5,867 | $501,000 | $208,000 | $293,000 |
| 2016 | $5,603 | $474,000 | $197,000 | $277,000 |
| 2015 | $5,124 | $449,000 | $187,000 | $262,000 |
| 2014 | -- | $392,000 | $170,000 | $222,000 |
| 2013 | -- | $322,000 | $140,000 | $182,000 |
Source: Public Records
Map
Nearby Homes
- 8907 NE 152nd Place
- 8746 NE 144th Ct
- 14808 84th Ave NE
- 14911 84th Ave NE
- 8401 NE 156th St
- 8403 NE 156th St
- 8407 NE 156th St
- 8254 NE 143rd Place
- 14713 98th Ave NE
- 9127 NE 160th Place
- 8031 NE 145th St
- 9813 NE 145th St
- 15615 Waynita Way NE Unit B-303
- 15505 81st Ave NE
- 15809 Waynita Way NE Unit G-302
- 9109 NE 141st Place
- 8801 NE 140th Place
- 7728 NE 151st Ln
- 15031 78th Ave NE
- 9213 Odin Way
- 14913 89th Place NE
- 14925 89th Place NE
- 14916 88th Place NE
- 14910 88th Place NE
- 14922 88th Place NE
- 14924 89th Place NE
- 14918 89th Place NE
- 14930 89th Place NE
- 14912 89th Place NE
- 8831 NE 149th Place
- 8842 NE 150th St
- 8837 NE 149th Place
- 8836 NE 150th St
- 8848 NE 150th St
- 8825 NE 149th Place
- 8830 NE 150th St
- 14900 89th Place NE
- 8819 NE 149th Place
- 8813 NE 150th St
- 14915 88th Place NE