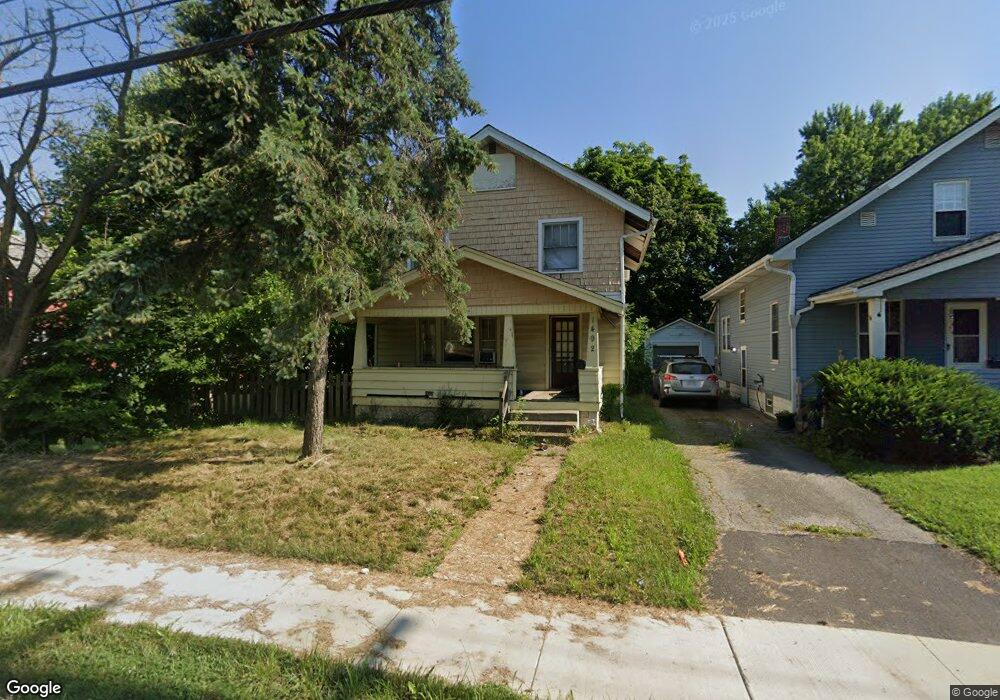
1492 E Hudson St Columbus, OH 43211
North Linden NeighborhoodEstimated Value: $125,000 - $170,000
3
Beds
1
Bath
1,318
Sq Ft
$118/Sq Ft
Est. Value
About This Home
This home is located at 1492 E Hudson St, Columbus, OH 43211 and is currently estimated at $155,441, approximately $117 per square foot. 1492 E Hudson St is a home located in Franklin County with nearby schools including Linden STEM Academy (K-6), Linden-Mckinley Stem School On Arcadia, and North Columbus Preparatory Academy.
Ownership History
Date
Name
Owned For
Owner Type
Purchase Details
Closed on
Dec 20, 2018
Sold by
Alkhatib Khalid
Bought by
Faradonia Investments Llc
Current Estimated Value
Purchase Details
Closed on
Sep 23, 2015
Sold by
Kabat Ghassan
Bought by
Khatib Khalid Al
Purchase Details
Closed on
Mar 23, 2012
Sold by
Pleasant Move Llc
Bought by
Kabat Ghassan
Purchase Details
Closed on
Jan 1, 2009
Sold by
El Khatib Nizam
Bought by
Pleasant Move Llc
Purchase Details
Closed on
May 29, 2008
Sold by
Deutsche Bank National Trust Co
Bought by
El Khatib Nizam
Purchase Details
Closed on
Apr 17, 2008
Sold by
Betts Louis F and Case #07Cve05 6473
Bought by
Deutsche Bank National Trust Co and Ffmlt 2006-Ff13
Purchase Details
Closed on
Jun 21, 1990
Bought by
Betts Louis F and Betts Bonnie J
Purchase Details
Closed on
Jan 12, 1990
Create a Home Valuation Report for This Property
The Home Valuation Report is an in-depth analysis detailing your home's value as well as a comparison with similar homes in the area
Home Values in the Area
Average Home Value in this Area
Purchase History
| Date | Buyer | Sale Price | Title Company |
|---|---|---|---|
| Faradonia Investments Llc | -- | None Available | |
| Khatib Khalid Al | $5,000 | Attorney | |
| Kabat Ghassan | $20,000 | None Available | |
| Pleasant Move Llc | -- | Attorney | |
| El Khatib Nizam | $14,000 | None Available | |
| Deutsche Bank National Trust Co | $38,000 | None Available | |
| Betts Louis F | $34,500 | -- | |
| -- | -- | -- |
Source: Public Records
Tax History
| Year | Tax Paid | Tax Assessment Tax Assessment Total Assessment is a certain percentage of the fair market value that is determined by local assessors to be the total taxable value of land and additions on the property. | Land | Improvement |
|---|---|---|---|---|
| 2025 | $6,351 | $53,900 | $10,780 | $43,120 |
| 2024 | $6,351 | $53,900 | $10,780 | $43,120 |
| 2023 | $2,439 | $53,900 | $10,780 | $43,120 |
| 2022 | $2,376 | $21,640 | $5,500 | $16,140 |
| 2021 | $1,152 | $21,640 | $5,500 | $16,140 |
| 2020 | $1,154 | $21,640 | $5,500 | $16,140 |
| 2019 | $1,084 | $17,440 | $4,800 | $12,640 |
| 2018 | $541 | $17,440 | $4,800 | $12,640 |
| 2017 | $1,084 | $17,440 | $4,800 | $12,640 |
| 2016 | $1,318 | $17,710 | $3,430 | $14,280 |
| 2015 | $648 | $17,710 | $3,430 | $14,280 |
| 2014 | $1,098 | $17,710 | $3,430 | $14,280 |
| 2013 | $733 | $20,825 | $4,025 | $16,800 |
Source: Public Records
Map
Nearby Homes
- 1509 Loretta Ave
- 1481 Kohr Place
- 1435 Kohr Place
- 1430 Kenmore Rd
- 2305 Cleveland Ave
- 1544 Briarwood Ave
- 1457 Cordell Ave
- 1450 Briarwood Ave
- 1362 Clinton St
- 2163 Cleveland Ave Unit 2161
- 2157 Cleveland Ave Unit 2153
- 1545 Arlington Ave
- 1625 Kenmore Rd
- 2126 Cleveland Ave
- 1564-1566 E Blake Ave
- 0 E Maynard Ave
- 2204 Medina Ave
- 2225 Medina Ave
- 2260 Homestead Dr
- 1554 E Maynard Ave
- 1498 E Hudson St
- 1504 E Hudson St
- 1480 E Hudson St
- 1508 E Hudson St
- 1474 E Hudson St
- 1499 Loretta Ave
- 1503 Loretta Ave Unit 505
- 1514 E Hudson St
- 1485 Loretta Ave
- 1495 E Hudson St
- 1513 Loretta Ave Unit 515
- 1513-1515 Loretta Ave
- 1481 E Hudson St
- 1481 Loretta Ave
- 1464 E Hudson St
- 1520 E Hudson St
- 1519 Loretta Ave
- 1475 E Hudson St
- 1507 E Hudson St
- 1475 Loretta Ave
Your Personal Tour Guide
Ask me questions while you tour the home.