Estimated Value: $706,791 - $834,000
3
Beds
4
Baths
3,078
Sq Ft
$246/Sq Ft
Est. Value
About This Home
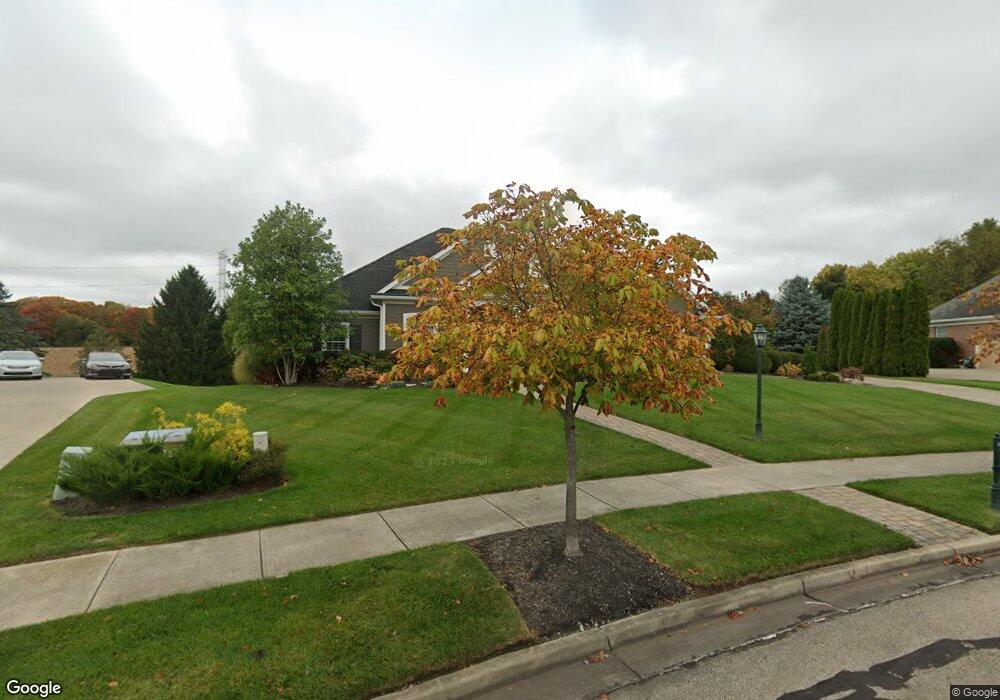
This home is located at 1492 Huntland Ct N, Xenia, OH 45385 and is currently estimated at $756,198, approximately $245 per square foot. 1492 Huntland Ct N is a home located in Greene County with nearby schools including Trebein Elementary School, Jacob Coy Middle School, and Beavercreek High School.
Ownership History
Date
Name
Owned For
Owner Type
Purchase Details
Closed on
Nov 3, 2022
Sold by
Schrader Jeffrey L
Bought by
Schrader Family Trust
Current Estimated Value
Purchase Details
Closed on
May 28, 2020
Sold by
Listerman David A and Sheridan Bridget A
Bought by
Schrader Jeffrey L and Schrader Cheryl B
Purchase Details
Closed on
Sep 19, 2019
Sold by
Listerman David A and Sheridan Bridget A
Bought by
Listerman David A and Sheridan Bridget A
Purchase Details
Closed on
Jun 14, 2006
Sold by
Stonehill Development Ltd
Bought by
Listerman David A and Sheridan Bridget A
Create a Home Valuation Report for This Property
The Home Valuation Report is an in-depth analysis detailing your home's value as well as a comparison with similar homes in the area
Home Values in the Area
Average Home Value in this Area
Purchase History
| Date | Buyer | Sale Price | Title Company |
|---|---|---|---|
| Schrader Family Trust | -- | -- | |
| Schrader Jeffrey L | $525,000 | None Available | |
| Listerman David A | -- | None Available | |
| Listerman David A | $90,000 | None Available |
Source: Public Records
Tax History Compared to Growth
Tax History
| Year | Tax Paid | Tax Assessment Tax Assessment Total Assessment is a certain percentage of the fair market value that is determined by local assessors to be the total taxable value of land and additions on the property. | Land | Improvement |
|---|---|---|---|---|
| 2024 | $12,547 | $223,090 | $36,750 | $186,340 |
| 2023 | $12,547 | $223,090 | $36,750 | $186,340 |
| 2022 | $11,727 | $182,760 | $28,270 | $154,490 |
| 2021 | $11,900 | $182,760 | $28,270 | $154,490 |
| 2020 | $11,900 | $182,760 | $28,270 | $154,490 |
| 2019 | $12,668 | $175,010 | $25,100 | $149,910 |
| 2018 | $11,076 | $175,010 | $25,100 | $149,910 |
| 2017 | $10,966 | $175,010 | $25,100 | $149,910 |
| 2016 | $10,817 | $168,550 | $25,100 | $143,450 |
| 2015 | $10,884 | $168,550 | $25,100 | $143,450 |
| 2014 | $10,639 | $168,550 | $25,100 | $143,450 |
Source: Public Records
Map
Nearby Homes
- 1382 Prestonwood Ct S
- 1247 Homestead Dr
- 1462 Champions Way
- 1678 Fairground Rd
- 1590 Windham Ln
- 1121 Westover Rd
- 1589 Stonebury Ct
- Torino II Plan at The Courtyards at Stonehill Village
- Palazzo Plan at The Courtyards at Stonehill Village
- Promenade III Plan at The Courtyards at Stonehill Village
- Portico Plan at The Courtyards at Stonehill Village
- Verona Plan at The Courtyards at Stonehill Village
- 1427 Triple Crown Way
- 2073 Lincolnshire Dr
- 1238 Freedom Point
- 1535 Stretch Dr
- 2162 Sulky Trail
- 1481 Stone Ridge Ct
- 2331 Eastwind Dr
- 1416 Hilltop Rd
- 1496 Huntland Ct N
- 1488 Huntland Ct N
- 1477 Huntland Ct N
- 1500 Huntland Ct N
- 1484 Huntland Ct N
- 1481 Huntland Ct N
- 1485 Huntland Ct N
- 1512 Kingsway Dr
- 1655 E Slatter Ct
- 1473 Huntland Ct N
- 1457 Huntland Ct N
- 1655 Ashmont Ct
- 1480 Huntland Ct N
- 1646 Ashmont Ct
- 1695 W Slatter Ct
- 1447 Huntland Ct N
- 1476 Huntland Ct N
- 1651 Ashmont Ct
- 1645 E Slatter Ct
- Lot 78 Huntland Ct N