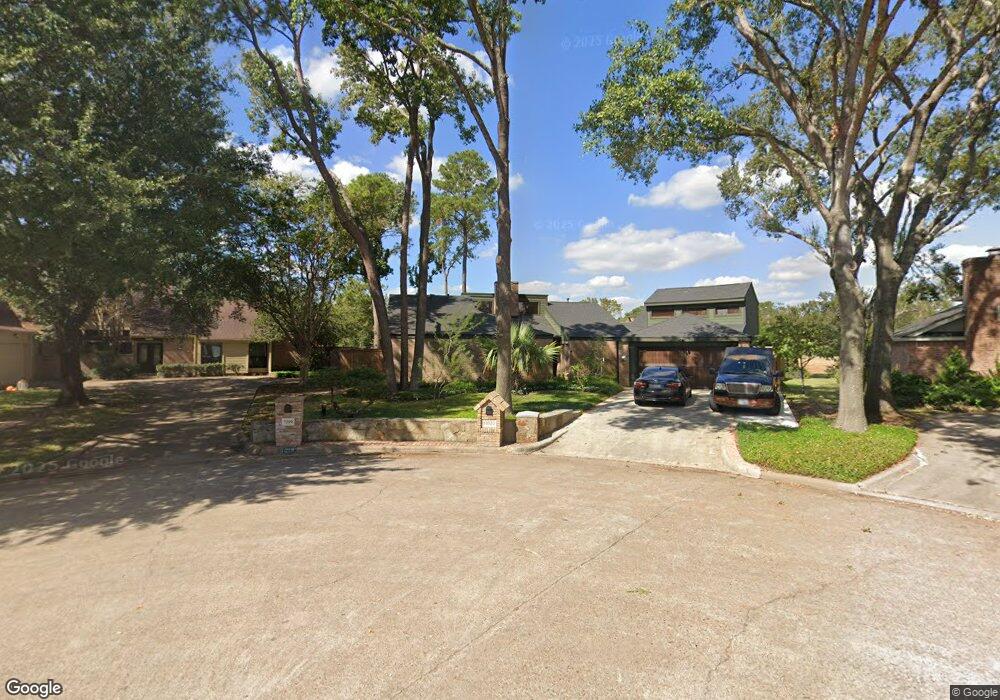
14922 Indian Quail Cir Houston, TX 77095
Hearthstone NeighborhoodEstimated Value: $330,079 - $365,000
3
Beds
3
Baths
2,259
Sq Ft
$155/Sq Ft
Est. Value
About This Home
This home is located at 14922 Indian Quail Cir, Houston, TX 77095 and is currently estimated at $350,770, approximately $155 per square foot. 14922 Indian Quail Cir is a home located in Harris County with nearby schools including Owens Elementary School, Labay Middle School, and Cypress Falls High School.
Ownership History
Date
Name
Owned For
Owner Type
Purchase Details
Closed on
Oct 30, 2008
Sold by
Hammonds Ronnie
Bought by
Orr Bill F
Current Estimated Value
Purchase Details
Closed on
Jul 29, 2005
Sold by
Harrison Steve L and Harrison Mary C
Bought by
Hammonds Ronnie
Purchase Details
Closed on
May 17, 2001
Sold by
Coleman Kenneth L and Coleman Sydney R
Bought by
Harrison Steve L and Harrison Mary C
Home Financials for this Owner
Home Financials are based on the most recent Mortgage that was taken out on this home.
Original Mortgage
$131,600
Interest Rate
6.99%
Purchase Details
Closed on
Jun 20, 1997
Sold by
Heuvel Roger Orrie Vanden and Machesney Lisa Ann
Bought by
Coleman Kenneth L and Coleman Sydney R
Home Financials for this Owner
Home Financials are based on the most recent Mortgage that was taken out on this home.
Original Mortgage
$119,050
Interest Rate
7.93%
Create a Home Valuation Report for This Property
The Home Valuation Report is an in-depth analysis detailing your home's value as well as a comparison with similar homes in the area
Home Values in the Area
Average Home Value in this Area
Purchase History
| Date | Buyer | Sale Price | Title Company |
|---|---|---|---|
| Orr Bill F | -- | Stewart Title Co Houston | |
| Hammonds Ronnie | -- | Stewart Title Houston | |
| Harrison Steve L | -- | American Title Co | |
| Coleman Kenneth L | -- | -- |
Source: Public Records
Mortgage History
| Date | Status | Borrower | Loan Amount |
|---|---|---|---|
| Previous Owner | Harrison Steve L | $131,600 | |
| Previous Owner | Coleman Kenneth L | $119,050 |
Source: Public Records
Tax History Compared to Growth
Tax History
| Year | Tax Paid | Tax Assessment Tax Assessment Total Assessment is a certain percentage of the fair market value that is determined by local assessors to be the total taxable value of land and additions on the property. | Land | Improvement |
|---|---|---|---|---|
| 2025 | $1,213 | $311,597 | $72,943 | $238,654 |
| 2024 | $1,213 | $338,303 | $72,943 | $265,360 |
| 2023 | $1,213 | $316,185 | $72,943 | $243,242 |
| 2022 | $6,086 | $291,800 | $55,938 | $235,862 |
| 2021 | $5,807 | $232,182 | $55,938 | $176,244 |
| 2020 | $5,946 | $237,745 | $46,988 | $190,757 |
| 2019 | $5,581 | $215,000 | $38,720 | $176,280 |
| 2018 | $1,202 | $200,000 | $38,720 | $161,280 |
| 2017 | $5,213 | $215,521 | $38,720 | $176,801 |
| 2016 | $5,134 | $197,000 | $38,720 | $158,280 |
| 2015 | $2,012 | $217,489 | $38,720 | $178,769 |
| 2014 | $2,012 | $205,293 | $38,720 | $166,573 |
Source: Public Records
Map
Nearby Homes
- 7106 Halfpenny Rd
- 7202 Benwich Cir
- 7111 Winding Walk Dr
- 15110 Runbell Place
- 7407 Bull Creek Rd
- 7215 Creek Crest Dr
- 7418 Benwich Cir
- 7306 Creek Crest Dr
- 14823 Elmont Dr
- 7035 Shasta Square
- 7203 W Hearthstone Green Dr
- 14719 Blooming Jasmine Trail
- 14731 Blooming Jasmine Trail
- 14721 Blooming Jasmine Trail
- 14729 Blooming Jasmine Trail
- 7238 N Hearthstone Green Dr
- 7315 Muirfield Valley Dr
- 7637 Ameswood Rd
- 7415 Broken Ridge Dr
- 6831 Hollow Hearth Dr
- 7219 Quail Field Dr
- 14918 Indian Quail Cir
- 7215 Quail Field Dr
- 14914 Indian Quail Cir
- 14910 Indian Quail Cir
- 14915 Indian Quail Cir
- 7211 Quail Field Dr
- 14906 Indian Quail Cir
- 14922 Heflin Ln
- 14907 Indian Quail Cir
- 14918 Heflin Ln
- 14902 Indian Quail Cir
- 7206 Halfpenny Rd
- 7210 Halfpenny Rd
- 14903 Indian Quail Cir
- 14914 Heflin Ln
- 7202 Halfpenny Rd
- 7122 Halfpenny Rd
- 7218 Winding Walk Dr
- 14910 Heflin Ln