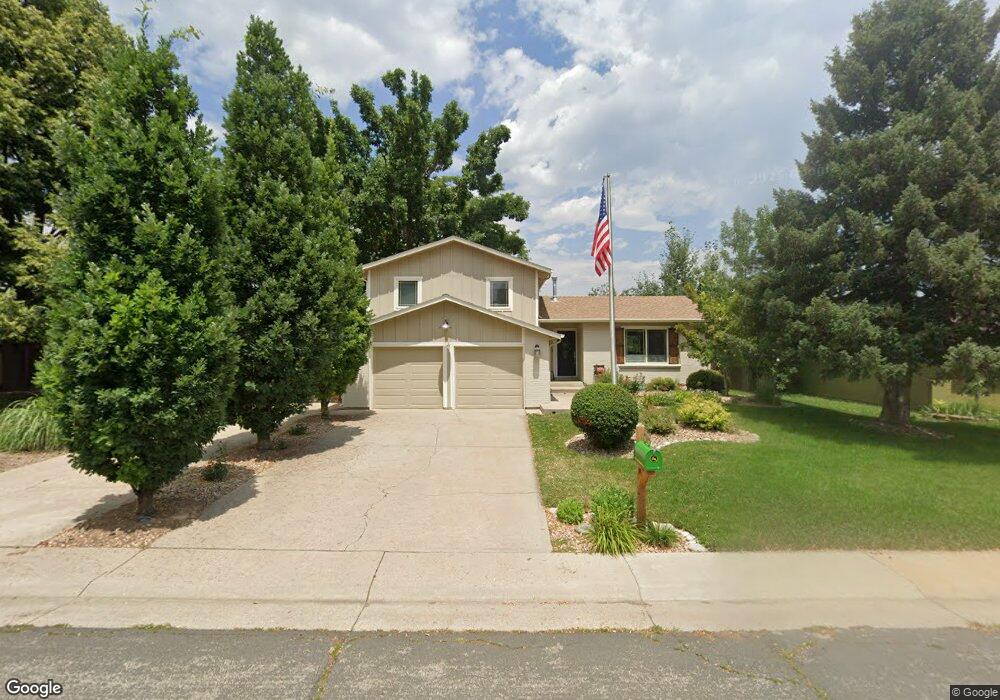
14925 W 54th Ave Golden, CO 80403
Estimated Value: $700,633 - $837,000
4
Beds
3
Baths
1,954
Sq Ft
$390/Sq Ft
Est. Value
About This Home
This home is located at 14925 W 54th Ave, Golden, CO 80403 and is currently estimated at $762,408, approximately $390 per square foot. 14925 W 54th Ave is a home located in Jefferson County with nearby schools including Fairmount Elementary School, Drake Junior High School, and Arvada West High School.
Ownership History
Date
Name
Owned For
Owner Type
Purchase Details
Closed on
Aug 11, 2011
Sold by
Knapp John A
Bought by
Knapp Taylor
Current Estimated Value
Home Financials for this Owner
Home Financials are based on the most recent Mortgage that was taken out on this home.
Original Mortgage
$220,000
Outstanding Balance
$152,041
Interest Rate
4.53%
Mortgage Type
New Conventional
Estimated Equity
$610,367
Purchase Details
Closed on
Apr 27, 2010
Sold by
Knapp Laurie D
Bought by
Knapp John A
Home Financials for this Owner
Home Financials are based on the most recent Mortgage that was taken out on this home.
Original Mortgage
$225,000
Interest Rate
4.91%
Mortgage Type
New Conventional
Purchase Details
Closed on
May 31, 2005
Sold by
Lampert Edward J and Lampert Lorraine K
Bought by
Knapp John A
Home Financials for this Owner
Home Financials are based on the most recent Mortgage that was taken out on this home.
Original Mortgage
$220,000
Interest Rate
5.87%
Mortgage Type
Purchase Money Mortgage
Create a Home Valuation Report for This Property
The Home Valuation Report is an in-depth analysis detailing your home's value as well as a comparison with similar homes in the area
Home Values in the Area
Average Home Value in this Area
Purchase History
| Date | Buyer | Sale Price | Title Company |
|---|---|---|---|
| Knapp Taylor | $275,000 | Land Title Guarantee Company | |
| Knapp John A | -- | Stewart Title | |
| Knapp John A | $275,000 | Land Title Guarantee Company |
Source: Public Records
Mortgage History
| Date | Status | Borrower | Loan Amount |
|---|---|---|---|
| Open | Knapp Taylor | $220,000 | |
| Previous Owner | Knapp John A | $225,000 | |
| Previous Owner | Knapp John A | $220,000 |
Source: Public Records
Tax History Compared to Growth
Tax History
| Year | Tax Paid | Tax Assessment Tax Assessment Total Assessment is a certain percentage of the fair market value that is determined by local assessors to be the total taxable value of land and additions on the property. | Land | Improvement |
|---|---|---|---|---|
| 2024 | $3,397 | $36,450 | $11,419 | $25,031 |
| 2023 | $3,397 | $36,450 | $11,419 | $25,031 |
| 2022 | $2,849 | $30,132 | $9,846 | $20,286 |
| 2021 | $2,900 | $31,000 | $10,130 | $20,870 |
| 2020 | $2,996 | $31,324 | $12,139 | $19,185 |
| 2019 | $2,889 | $31,324 | $12,139 | $19,185 |
| 2018 | $2,139 | $22,459 | $9,883 | $12,576 |
| 2017 | $1,953 | $22,459 | $9,883 | $12,576 |
| 2016 | $2,219 | $23,933 | $7,989 | $15,944 |
| 2015 | $1,660 | $23,933 | $7,989 | $15,944 |
| 2014 | $1,660 | $17,457 | $7,411 | $10,046 |
Source: Public Records
Map
Nearby Homes
- 14993 W 55th Dr
- 14290 W 54th Ave
- 5287 Flora Way
- 5683 Fig Way
- 14880 W 58th Ave
- 5390 Nile St
- 15020 W 58th Ave
- 5799 Howell Ct
- 14417 W 57th Place
- 14955 W 58th Place
- 5726 Fig Ct
- 14195 W 50th Ave
- 14185 W 50th Ave
- 15376 W 49th Dr
- 5052 Nile Ct
- 15955 W 52nd Dr
- 5266 Flora Way
- 5256 Flora Way
- 5316 Flora Way
- 5286 Flora Way
- 14905 W 54th Ave
- 14955 W 54th Ave
- 14895 W 54th Ave
- 14995 W 54th Ave
- 14968 W 54th Dr
- 14938 W 54th Dr
- 14910 W 54th Ave
- 14950 W 54th Ave
- 14988 W 54th Dr
- 14898 W 54th Dr
- 14890 W 54th Ave
- 14855 W 54th Ave
- 5388 Joyce St
- 15028 W 54th Dr
- 14860 W 54th Ave
- 14878 W 54th Dr
- 5399 Joyce St
- 14825 W 54th Ave
- 15015 W 53rd Place
- 14905 W 53rd Ave