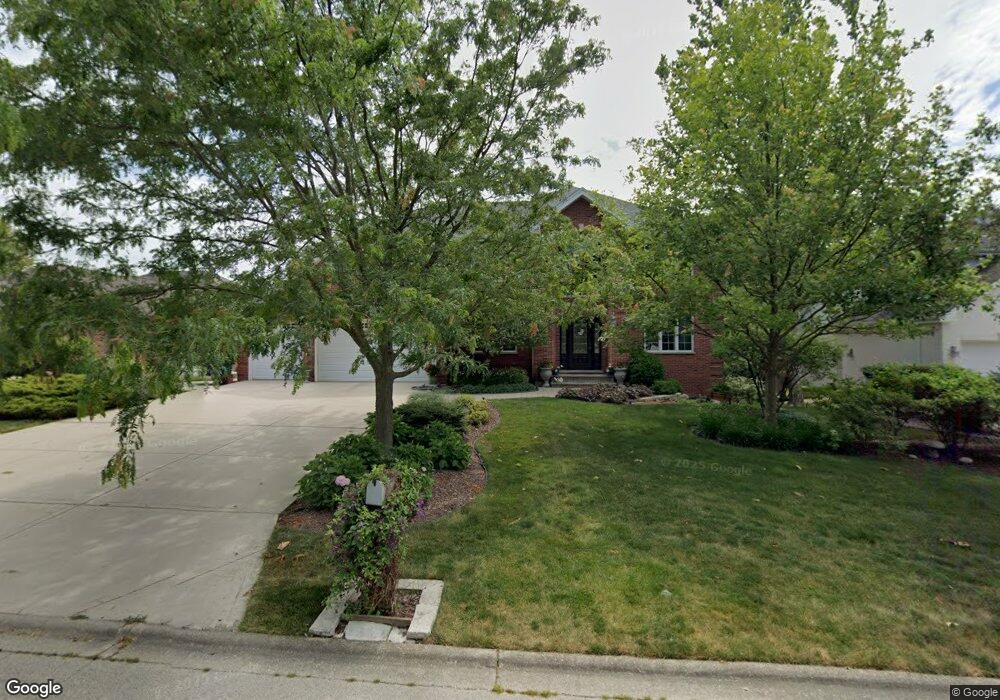
14927 Allison Ln Homer Glen, IL 60491
Estimated Value: $540,000 - $943,000
5
Beds
4
Baths
3,708
Sq Ft
$205/Sq Ft
Est. Value
About This Home
This home is located at 14927 Allison Ln, Homer Glen, IL 60491 and is currently estimated at $760,661, approximately $205 per square foot. 14927 Allison Ln is a home located in Will County with nearby schools including Hadley Middle School, Luther J Schilling School, and Homer Jr High School.
Ownership History
Date
Name
Owned For
Owner Type
Purchase Details
Closed on
May 19, 2005
Sold by
Malioris John A and Malioris Sharon D
Bought by
Malioris John A and Malioris Sharon S
Current Estimated Value
Purchase Details
Closed on
Jul 14, 2004
Sold by
Standard Bank & Trust Co
Bought by
Malioris John A and Malioris Sharon D
Home Financials for this Owner
Home Financials are based on the most recent Mortgage that was taken out on this home.
Original Mortgage
$490,500
Interest Rate
6.4%
Mortgage Type
Credit Line Revolving
Purchase Details
Closed on
Sep 27, 2002
Sold by
Standard Bank & Trust Co Hickory Hills
Bought by
Fazio Brothers Inc
Create a Home Valuation Report for This Property
The Home Valuation Report is an in-depth analysis detailing your home's value as well as a comparison with similar homes in the area
Home Values in the Area
Average Home Value in this Area
Purchase History
| Date | Buyer | Sale Price | Title Company |
|---|---|---|---|
| Malioris John A | -- | -- | |
| Malioris John A | $543,000 | -- | |
| Fazio Brothers Inc | $119,000 | Ticor Title |
Source: Public Records
Mortgage History
| Date | Status | Borrower | Loan Amount |
|---|---|---|---|
| Closed | Malioris John A | $490,500 |
Source: Public Records
Tax History Compared to Growth
Tax History
| Year | Tax Paid | Tax Assessment Tax Assessment Total Assessment is a certain percentage of the fair market value that is determined by local assessors to be the total taxable value of land and additions on the property. | Land | Improvement |
|---|---|---|---|---|
| 2024 | $13,455 | $251,458 | $55,072 | $196,386 |
| 2023 | $13,455 | $227,935 | $49,920 | $178,015 |
| 2022 | $16,245 | $212,825 | $46,611 | $166,214 |
| 2021 | $14,230 | $201,634 | $44,160 | $157,474 |
| 2020 | $14,850 | $194,215 | $42,535 | $151,680 |
| 2019 | $14,141 | $186,835 | $40,919 | $145,916 |
| 2018 | $13,787 | $180,492 | $40,450 | $140,042 |
| 2017 | $13,526 | $175,440 | $39,318 | $136,122 |
| 2016 | $13,187 | $169,589 | $38,007 | $131,582 |
| 2015 | $13,229 | $163,223 | $36,580 | $126,643 |
| 2014 | $13,229 | $159,850 | $35,824 | $124,026 |
| 2013 | $13,229 | $159,850 | $35,824 | $124,026 |
Source: Public Records
Map
Nearby Homes
- 15022 S Woodcrest Ave Unit 3
- 12222 Rambling Rd
- 14715 S Woodcrest Ave
- 12459 Rosewood Dr Unit 1
- Fremont Plan at Kingston Hills
- Briarcliffe Plan at Kingston Hills
- Danbury Plan at Kingston Hills
- Calysta Plan at Kingston Hills
- Eden Plan at Kingston Hills
- Amberwood Plan at Kingston Hills
- 15328 Sharon Dr
- 15220 Arbor Dr
- 87 Windmill Rd
- 14748 S Carlton Ln
- 14561 S Appaloosa Ln
- 14405 Creekwood Dr
- 15141 Arbor Dr
- 80 Windmill Rd
- 14542 S Mustang Dr
- 14225 Mallard Dr
- 14935 Allison Ln
- 14919 Allison Ln
- 14909 Allison Ln
- 14954 Wilco Dr
- 14958 Wilco Dr
- 14950 Wilco Dr
- 14930 Allison Ln
- 14962 Wilco Dr
- 12211 W Spring Lake Dr
- 14951 Allison Ln
- 12245 W Spring Lake Dr
- 14946 Wilco Dr
- 14944 Wilco Dr
- 14952 Allison Ln
- 15001 Allison Ln
- 12255 W Spring Lake Dr
- 12220 W Spring Lake Dr
- 14947 Wilco Dr
- 15008 Wilco Dr
- 12141 W Edgewood Dr