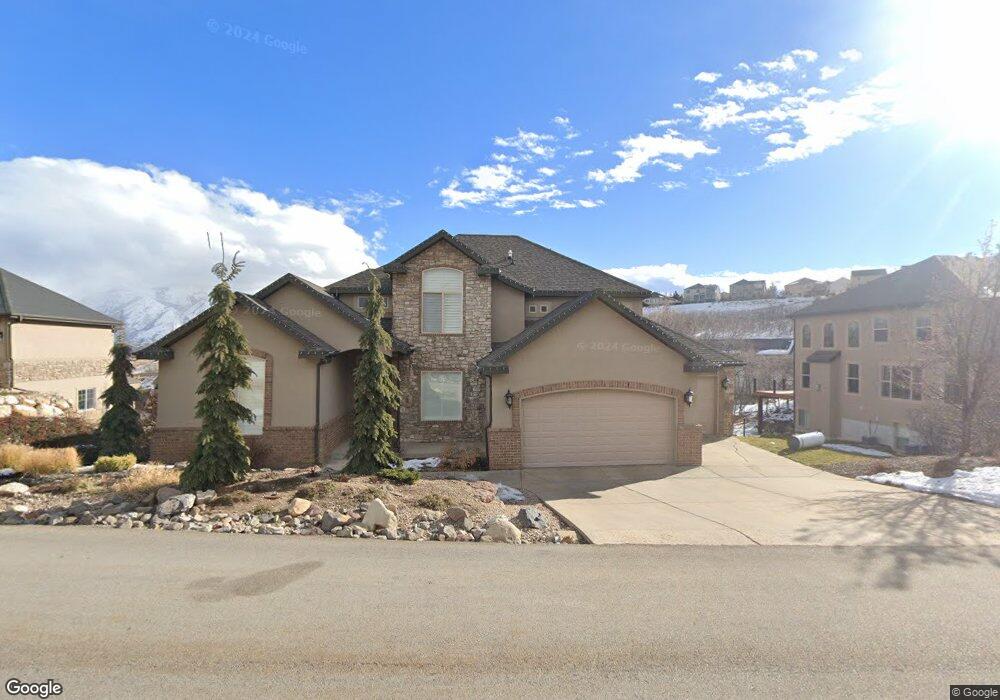
14927 S Laurel Oaks Ct Draper, UT 84020
Estimated Value: $1,030,000 - $1,067,000
4
Beds
3
Baths
4,665
Sq Ft
$224/Sq Ft
Est. Value
About This Home
This home is located at 14927 S Laurel Oaks Ct, Draper, UT 84020 and is currently estimated at $1,047,159, approximately $224 per square foot. 14927 S Laurel Oaks Ct is a home located in Salt Lake County with nearby schools including Oak Hollow School, Draper Park Middle School, and Corner Canyon High School.
Ownership History
Date
Name
Owned For
Owner Type
Purchase Details
Closed on
Jul 2, 2021
Sold by
Nilsson Ryan M and Nilsson Mary Brooke
Bought by
Nilsson Ryan M and Nilsson Mary Brooke
Current Estimated Value
Home Financials for this Owner
Home Financials are based on the most recent Mortgage that was taken out on this home.
Original Mortgage
$548,250
Outstanding Balance
$497,452
Interest Rate
2.9%
Mortgage Type
New Conventional
Estimated Equity
$549,707
Purchase Details
Closed on
Dec 23, 2013
Sold by
Nilsson Ryan M
Bought by
Nilsson Ryan M and Nilsson Mary Brook
Purchase Details
Closed on
Aug 16, 2013
Sold by
Walker Joseph B and Walker Eliana Theresa
Bought by
Nilsson Ryan M
Home Financials for this Owner
Home Financials are based on the most recent Mortgage that was taken out on this home.
Original Mortgage
$415,150
Interest Rate
3.87%
Mortgage Type
Adjustable Rate Mortgage/ARM
Purchase Details
Closed on
Mar 1, 2010
Sold by
Walker Joseph B and Walker Eliana Theresa
Bought by
Walker Joseph B and Walker Eliana Theresa
Home Financials for this Owner
Home Financials are based on the most recent Mortgage that was taken out on this home.
Original Mortgage
$336,800
Interest Rate
4.97%
Mortgage Type
New Conventional
Purchase Details
Closed on
Jul 21, 2008
Sold by
Citimortgage Inc
Bought by
Walker Joseph B and Walker Eliana Theresa
Home Financials for this Owner
Home Financials are based on the most recent Mortgage that was taken out on this home.
Original Mortgage
$336,000
Interest Rate
6.07%
Mortgage Type
Purchase Money Mortgage
Purchase Details
Closed on
Feb 5, 2008
Sold by
Gove Chad A
Bought by
Citimortgage Inc
Purchase Details
Closed on
Dec 21, 2006
Sold by
Grace Associates Inc
Bought by
Gove Chad A
Home Financials for this Owner
Home Financials are based on the most recent Mortgage that was taken out on this home.
Original Mortgage
$750,000
Interest Rate
8%
Mortgage Type
Purchase Money Mortgage
Purchase Details
Closed on
Mar 13, 2006
Sold by
Falk Kenneth B and Falk Maryann
Bought by
Grace Associates Inc
Purchase Details
Closed on
Mar 29, 2005
Sold by
Suncrest Llc
Bought by
Falk Kenneth Brett and Falk Maryann
Home Financials for this Owner
Home Financials are based on the most recent Mortgage that was taken out on this home.
Original Mortgage
$480,000
Interest Rate
5.7%
Mortgage Type
Construction
Create a Home Valuation Report for This Property
The Home Valuation Report is an in-depth analysis detailing your home's value as well as a comparison with similar homes in the area
Home Values in the Area
Average Home Value in this Area
Purchase History
| Date | Buyer | Sale Price | Title Company |
|---|---|---|---|
| Nilsson Ryan M | -- | Title Guarantee S Jordan | |
| Nilsson Ryan M | -- | Bonneville Superior Title | |
| Nilsson Ryan M | -- | Bonneville Superior Title | |
| Walker Joseph B | -- | First American Title | |
| Walker Joseph B | -- | First American Title | |
| Citimortgage Inc | $811,870 | None Available | |
| Gove Chad A | -- | Preferred Title & Escrow Ins | |
| Grace Associates Inc | -- | Accommodation | |
| Falk Kenneth Brett | -- | Mt Olympus Title |
Source: Public Records
Mortgage History
| Date | Status | Borrower | Loan Amount |
|---|---|---|---|
| Open | Nilsson Ryan M | $548,250 | |
| Previous Owner | Nilsson Ryan M | $415,150 | |
| Previous Owner | Walker Joseph B | $336,800 | |
| Previous Owner | Walker Joseph B | $336,000 | |
| Previous Owner | Gove Chad A | $750,000 | |
| Previous Owner | Falk Kenneth Brett | $480,000 |
Source: Public Records
Tax History Compared to Growth
Tax History
| Year | Tax Paid | Tax Assessment Tax Assessment Total Assessment is a certain percentage of the fair market value that is determined by local assessors to be the total taxable value of land and additions on the property. | Land | Improvement |
|---|---|---|---|---|
| 2025 | $4,426 | $884,500 | $328,700 | $555,800 |
| 2024 | $4,426 | $845,500 | $309,500 | $536,000 |
| 2023 | $4,237 | $803,400 | $279,400 | $524,000 |
| 2022 | $4,382 | $802,600 | $273,900 | $528,700 |
| 2021 | $4,228 | $661,500 | $205,400 | $456,100 |
| 2020 | $3,870 | $574,000 | $154,500 | $419,500 |
| 2019 | $3,898 | $564,900 | $144,300 | $420,600 |
| 2018 | $3,661 | $542,200 | $138,000 | $404,200 |
| 2017 | $3,551 | $503,800 | $138,000 | $365,800 |
| 2016 | $3,728 | $514,100 | $115,500 | $398,600 |
| 2015 | $2,944 | $375,900 | $92,500 | $283,400 |
| 2014 | $3,266 | $407,400 | $141,900 | $265,500 |
Source: Public Records
Map
Nearby Homes
- 14902 S Saddle Leaf Ct
- 14849 S Saddle Leaf Ct
- 15095 Alder Glen Ln
- 1945 E Seven Oaks Ln
- 14708 S Woods Landing Ct
- 1795 E Walnut Grove Dr
- 14678 S Woods Landing Ct
- 1871 E Vista Ridge Ct
- 14781 S Glamis Ct
- 1515 E Bluff Point Dr
- 1547 E Deer Ridge Dr Unit 85
- 14775 S Falkland Cove
- 14747 S Haddington Rd
- 15211 S Tall Woods Dr Unit 24
- 1468 E Trail Crest Ct
- 1463 Meadow Bluff Ln Unit 66
- 14767 S Invergarry Ct
- 1487 E Deer Ridge Dr
- 1459 E Meadow Bluff Ln
- 2208 E Snow Blossom Way
- 14927 Laurel Oaks Ct
- 14915 Laurel Oaks Ct
- 14915 S Laurel Oaks Ct
- 14943 Laurel Oaks Ct
- 14943 S Laurel Oaks Ct
- 1833 E Seven Oaks Ln
- 13286 S Laurel Oaks Ct
- 1833 E Seven Oaks Ln
- 1803 E Seven Oaks Ln
- 1803 Seven Oaks Ln
- 14918 S Laurel Oaks Ct Unit 409
- 1837 E Seven Oaks Ln Unit 420
- 1837 E Seven Oaks Ln
- 1837 E Seven Oaks Ln Unit 420
- 14946 S Laurel Oaks Ct
- 14963 Laurel Oaks Ct
- 14907 Laurel Oaks Ct
- 14932 S Laurel Oaks Ct
- 14932 Laurel Oaks Ct
- 1823 E Seven Oaks Ln