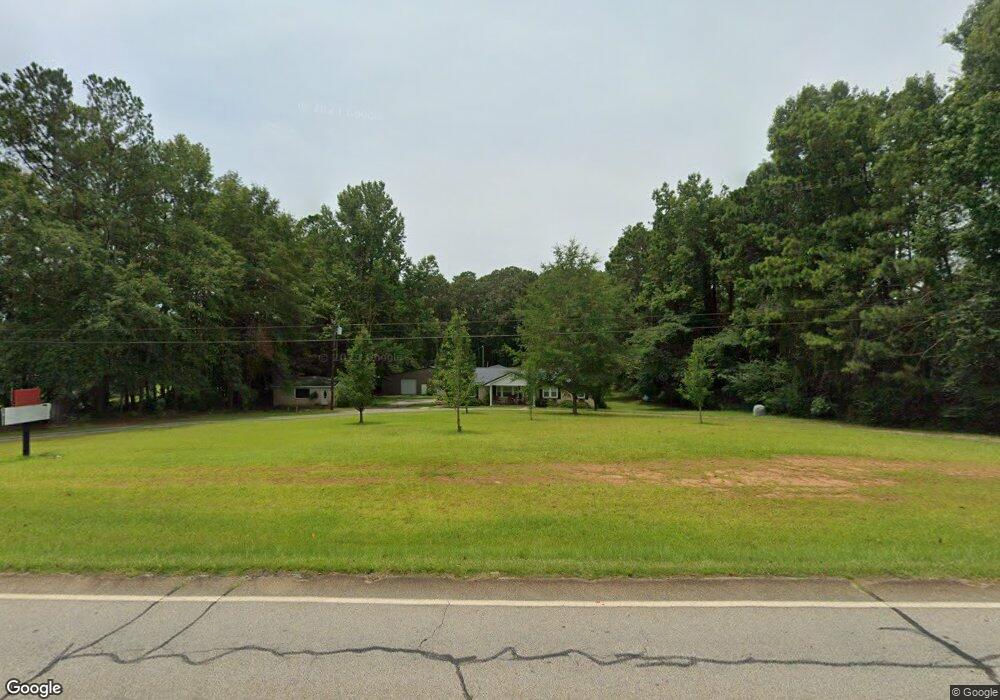
1493 Corinth Rd Unit 11&12 Hogansville, GA 30230
Estimated Value: $213,000 - $334,000
3
Beds
2
Baths
2,024
Sq Ft
$133/Sq Ft
Est. Value
About This Home
This home is located at 1493 Corinth Rd Unit 11&12, Hogansville, GA 30230 and is currently estimated at $269,451, approximately $133 per square foot. 1493 Corinth Rd Unit 11&12 is a home located in Troup County with nearby schools including Hogansville Elementary School, Callaway Elementary School, and Callaway Middle School.
Ownership History
Date
Name
Owned For
Owner Type
Purchase Details
Closed on
Mar 30, 2011
Sold by
Parmot Investments Llc
Bought by
Smith Matty L
Current Estimated Value
Home Financials for this Owner
Home Financials are based on the most recent Mortgage that was taken out on this home.
Original Mortgage
$68,225
Outstanding Balance
$47,223
Interest Rate
4.87%
Mortgage Type
FHA
Estimated Equity
$222,228
Purchase Details
Closed on
Jul 7, 2009
Sold by
Smith Robert Jerry
Bought by
Roberts Keith
Purchase Details
Closed on
Dec 7, 2000
Sold by
Eula Hazel Butler Smith
Bought by
Smith Robert Jerry
Purchase Details
Closed on
Aug 23, 1974
Bought by
Eula Hazel Butler Smith
Purchase Details
Closed on
Aug 9, 1974
Purchase Details
Closed on
Jan 1, 1972
Create a Home Valuation Report for This Property
The Home Valuation Report is an in-depth analysis detailing your home's value as well as a comparison with similar homes in the area
Home Values in the Area
Average Home Value in this Area
Purchase History
| Date | Buyer | Sale Price | Title Company |
|---|---|---|---|
| Smith Matty L | $70,000 | -- | |
| Smith Matty L | $70,000 | -- | |
| Roberts Keith | $6,000 | -- | |
| Roberts Keith | $6,000 | -- | |
| Smith Robert Jerry | -- | -- | |
| Eula Hazel Butler Smith | $2,000 | -- | |
| -- | -- | -- | |
| -- | -- | -- |
Source: Public Records
Mortgage History
| Date | Status | Borrower | Loan Amount |
|---|---|---|---|
| Open | Smith Matty L | $68,225 | |
| Closed | Roberts Keith | $68,225 |
Source: Public Records
Tax History Compared to Growth
Tax History
| Year | Tax Paid | Tax Assessment Tax Assessment Total Assessment is a certain percentage of the fair market value that is determined by local assessors to be the total taxable value of land and additions on the property. | Land | Improvement |
|---|---|---|---|---|
| 2024 | $2,026 | $76,280 | $6,400 | $69,880 |
| 2023 | $1,930 | $72,760 | $6,400 | $66,360 |
| 2022 | $1,893 | $69,800 | $6,400 | $63,400 |
| 2021 | $1,877 | $64,240 | $5,720 | $58,520 |
| 2020 | $1,877 | $64,240 | $5,720 | $58,520 |
| 2019 | $1,773 | $60,760 | $5,800 | $54,960 |
| 2018 | $1,622 | $55,760 | $5,800 | $49,960 |
| 2017 | $1,622 | $55,760 | $5,800 | $49,960 |
| 2016 | $1,628 | $55,977 | $5,800 | $50,177 |
| 2015 | $1,631 | $55,977 | $5,800 | $50,177 |
| 2014 | $1,312 | $53,337 | $5,800 | $47,537 |
| 2013 | -- | $53,693 | $5,800 | $47,893 |
Source: Public Records
Map
Nearby Homes
- 993 Glover Rd
- 0 Melson Rd Unit 10626183
- 243 Ralls Rd
- 423 Coweta Heard Rd
- 221 Power Plant Rd
- 1072 Minardi Dr
- 402 Power Plant Rd
- 606 Green Ave
- 407 Green Ave
- 717 N Boyd Rd
- GARDNER Plan at Huntcliff - Villages
- ESSEX Plan at Huntcliff - Villages
- DUPONT Plan at Huntcliff - Villages
- ROANOKE Plan at Huntcliff - Villages
- 618 Rifle Ridge
- 100 International St
- 501 Sporting Dr
- 502 Sporting Dr
- 500 Sporting Dr
- 404 Lincoln St
- 1493 Corinth Rd
- 1502 Corinth Rd
- 1478 Corinth Rd
- 1451 Corinth Rd
- 1537 Corinth Rd
- 1534 Corinth Rd
- 1454 Corinth Rd
- 1545 Corinth Rd
- 1565 Corinth Rd
- 1428 Corinth Rd
- 1415 Corinth Rd
- 1575 Corinth Rd
- 1474 Corinth Rd
- 1514 Corinth Rd
- 113 Waterwood Bend
- 1387 Corinth Rd
- 115 Waterwood Bend
- 1581 Corinth Rd
- 1603 Corinth Rd
- 1384 Corinth Rd