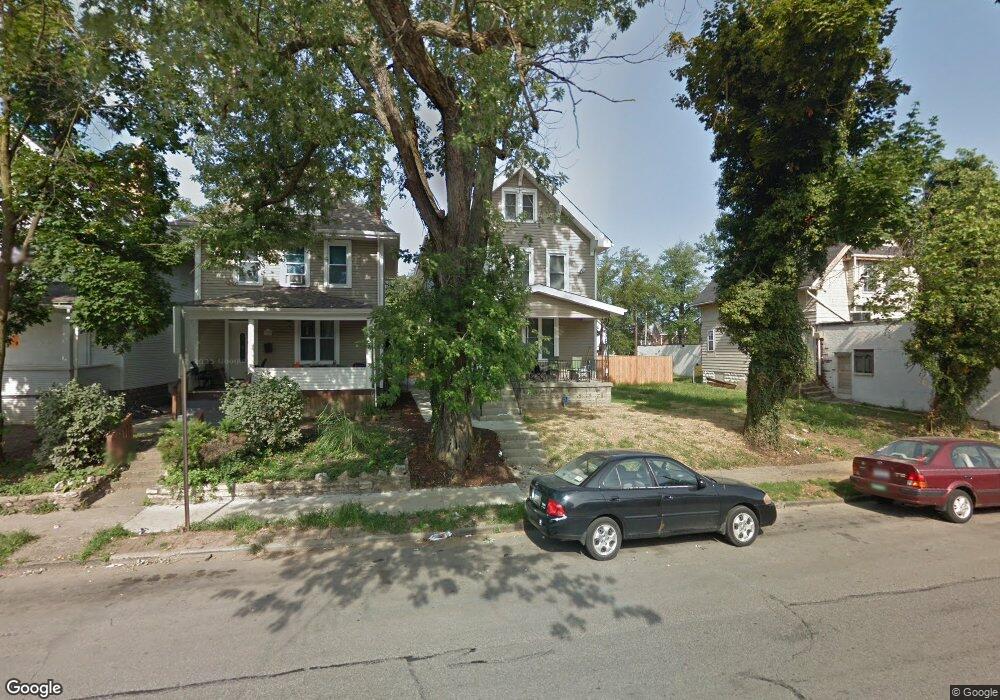
1493 N 4th St Columbus, OH 43201
Weinland Park NeighborhoodEstimated Value: $314,158 - $517,000
3
Beds
2
Baths
1,558
Sq Ft
$263/Sq Ft
Est. Value
About This Home
This home is located at 1493 N 4th St, Columbus, OH 43201 and is currently estimated at $409,790, approximately $263 per square foot. 1493 N 4th St is a home located in Franklin County with nearby schools including Weinland Park Elementary School, Dominion Middle School, and Whetstone High School.
Ownership History
Date
Name
Owned For
Owner Type
Purchase Details
Closed on
Dec 5, 2014
Sold by
Gitonga Kaihuri Wanjema
Bought by
Diamond Properties Of Central Ohio Llc
Current Estimated Value
Purchase Details
Closed on
Jul 27, 2012
Sold by
Porter Gregory L
Bought by
Gitonga Kqihuri Wanjemd
Purchase Details
Closed on
Jun 18, 2012
Sold by
Vazirani S M
Bought by
Porter Gregory L
Purchase Details
Closed on
May 29, 2012
Sold by
Vazirani Sam
Bought by
Porter Gregory L
Purchase Details
Closed on
Feb 14, 2001
Sold by
Alliance Mtg Company
Bought by
Vazirani Sam
Purchase Details
Closed on
Sep 19, 2000
Sold by
Edwards Franlklin
Bought by
Alliance Mtg Company
Purchase Details
Closed on
Mar 31, 1989
Bought by
Edwards Franlklin
Create a Home Valuation Report for This Property
The Home Valuation Report is an in-depth analysis detailing your home's value as well as a comparison with similar homes in the area
Home Values in the Area
Average Home Value in this Area
Purchase History
| Date | Buyer | Sale Price | Title Company |
|---|---|---|---|
| Diamond Properties Of Central Ohio Llc | $31,500 | None Available | |
| Gitonga Kqihuri Wanjemd | $48,000 | None Available | |
| Porter Gregory L | -- | First American Title Insuran | |
| Porter Gregory L | $5,000 | None Available | |
| Vazirani Sam | $15,000 | Independent Title | |
| Alliance Mtg Company | $8,000 | Independent Title | |
| Edwards Franlklin | -- | -- |
Source: Public Records
Tax History Compared to Growth
Tax History
| Year | Tax Paid | Tax Assessment Tax Assessment Total Assessment is a certain percentage of the fair market value that is determined by local assessors to be the total taxable value of land and additions on the property. | Land | Improvement |
|---|---|---|---|---|
| 2024 | $2,464 | $96,110 | $36,750 | $59,360 |
| 2023 | $2,433 | $96,110 | $36,750 | $59,360 |
| 2022 | $1,028 | $48,580 | $7,000 | $41,580 |
| 2021 | $1,046 | $48,580 | $7,000 | $41,580 |
| 2020 | $1,008 | $48,580 | $7,000 | $41,580 |
| 2019 | $905 | $37,380 | $5,390 | $31,990 |
| 2018 | $703 | $37,380 | $5,390 | $31,990 |
| 2017 | $1,624 | $37,380 | $5,390 | $31,990 |
| 2016 | $923 | $13,590 | $5,150 | $8,440 |
| 2015 | $503 | $7,570 | $5,150 | $2,420 |
| 2014 | $469 | $7,570 | $5,150 | $2,420 |
| 2013 | $237 | $6,895 | $4,690 | $2,205 |
Source: Public Records
Map
Nearby Homes
- 1444 Hamlet St Unit 446
- 1429 N 6th St Unit 431
- 1438 N 6th St Unit 440
- 1413 N Grant Ave
- 170 Chittenden Ave Unit 168
- 1337 N 5th St
- 1410 Indianola Ave
- 1342 Hamlet St Unit 344
- 1404 Indianola Ave
- 1322 N 5th St
- 401 E 13th Ave Unit 403
- 403 E 13th Ave
- 357 E 14th Ave
- 49 Euclid Ave
- 126 E 6th Ave Unit 26
- 1325 Indianola Ave Unit 325
- 1239 Cromartie Ln
- 1233 Cromartie Ln
- 1248 N Grant Ave Unit S
- 1250 N Grant Ave
- 1489 N 4th St
- 1497 N 4th St
- 1483 N 4th St
- 1503 N 4th St
- 256 E 9th Ave
- 1479 N 4th St
- 1505 N 4th St
- 1505 N 4th St Unit TWENTY
- 1505 N 4th St
- 1502 Hamlet St
- 1504 Hamlet St
- 1510 Hamlet St
- 1484 N 4th St Unit TWENTY
- 1498 Hamlet St
- 1488 Hamlet St
- 1514 Hamlet St
- 1521 N 4th St Unit TWENTY
- 1492 Hamlet St
- 1467 N 4th St Unit TWENTY
- 1467 N 4th St Unit 469