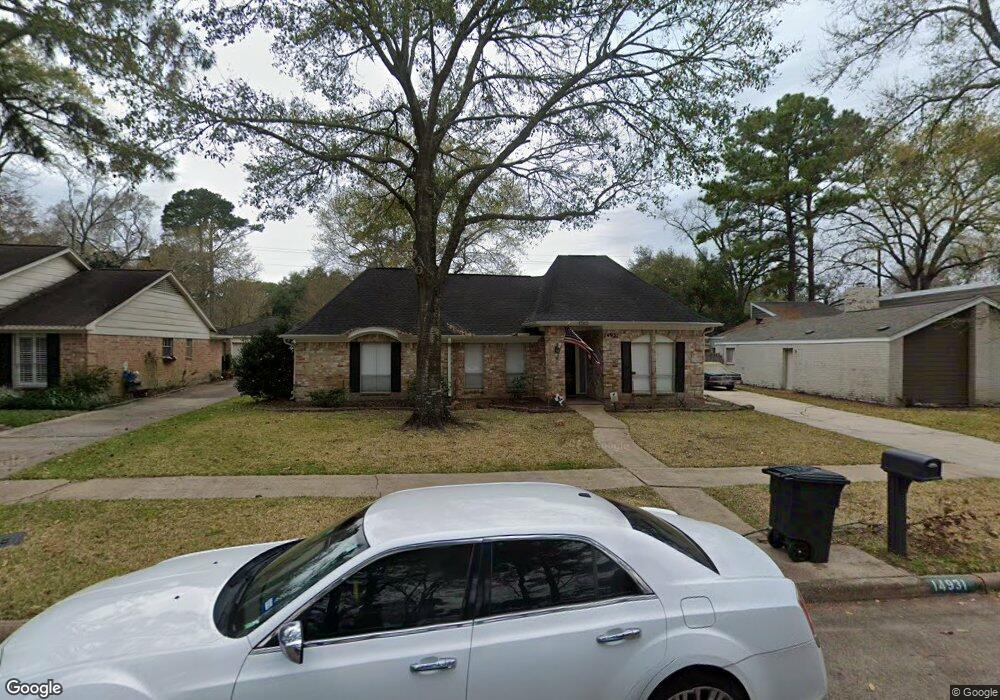
14931 Spring Lake Dr Houston, TX 77070
Estimated Value: $277,135 - $296,000
3
Beds
3
Baths
1,811
Sq Ft
$158/Sq Ft
Est. Value
About This Home
This home is located at 14931 Spring Lake Dr, Houston, TX 77070 and is currently estimated at $285,284, approximately $157 per square foot. 14931 Spring Lake Dr is a home located in Harris County with nearby schools including Moore Elementary School, Hamilton Middle School, and Cypress Creek High School.
Ownership History
Date
Name
Owned For
Owner Type
Purchase Details
Closed on
Jul 31, 2013
Sold by
Merchant Amanda M and Klaus Amanda Michelle
Bought by
Ashby Susan
Current Estimated Value
Home Financials for this Owner
Home Financials are based on the most recent Mortgage that was taken out on this home.
Original Mortgage
$123,200
Outstanding Balance
$89,911
Interest Rate
3.93%
Mortgage Type
New Conventional
Estimated Equity
$195,373
Purchase Details
Closed on
May 26, 2010
Sold by
Macmahon Brian and Macmahon Diann
Bought by
Klaus Amanda Michelle
Home Financials for this Owner
Home Financials are based on the most recent Mortgage that was taken out on this home.
Original Mortgage
$135,179
Interest Rate
5.5%
Mortgage Type
FHA
Purchase Details
Closed on
Oct 26, 2009
Sold by
Conrad Ann W
Bought by
Macmahon Brian and Macmahon Diann
Purchase Details
Closed on
Jan 29, 2003
Sold by
Tran Tuan Anh and Tran Can Quang
Bought by
Martin Melissa Bobbi
Create a Home Valuation Report for This Property
The Home Valuation Report is an in-depth analysis detailing your home's value as well as a comparison with similar homes in the area
Home Values in the Area
Average Home Value in this Area
Purchase History
| Date | Buyer | Sale Price | Title Company |
|---|---|---|---|
| Ashby Susan | -- | Great American Title | |
| Klaus Amanda Michelle | -- | American Title Company | |
| Macmahon Brian | -- | American Title Company | |
| Martin Melissa Bobbi | -- | American Title Co |
Source: Public Records
Mortgage History
| Date | Status | Borrower | Loan Amount |
|---|---|---|---|
| Open | Ashby Susan | $123,200 | |
| Previous Owner | Klaus Amanda Michelle | $135,179 |
Source: Public Records
Tax History Compared to Growth
Tax History
| Year | Tax Paid | Tax Assessment Tax Assessment Total Assessment is a certain percentage of the fair market value that is determined by local assessors to be the total taxable value of land and additions on the property. | Land | Improvement |
|---|---|---|---|---|
| 2025 | $3,983 | $285,449 | $74,970 | $210,479 |
| 2024 | $3,983 | $267,256 | $74,970 | $192,286 |
| 2023 | $3,983 | $287,184 | $74,970 | $212,214 |
| 2022 | $5,528 | $270,057 | $62,475 | $207,582 |
| 2021 | $5,296 | $223,084 | $62,475 | $160,609 |
| 2020 | $4,966 | $191,068 | $48,314 | $142,754 |
| 2019 | $5,222 | $193,466 | $31,238 | $162,228 |
| 2018 | $1,746 | $182,802 | $31,238 | $151,564 |
| 2017 | $4,889 | $182,802 | $31,238 | $151,564 |
| 2016 | $4,587 | $171,516 | $31,238 | $140,278 |
| 2015 | $3,130 | $171,516 | $31,238 | $140,278 |
| 2014 | $3,130 | $144,510 | $26,240 | $118,270 |
Source: Public Records
Map
Nearby Homes
- 14918 Shady Bend Dr
- 14902 Forest Lodge Dr
- 12120 Silver Creek Dr
- 15002 Carols Way Dr
- 14615 Sunny Grove Dr
- 14703 Forest Lodge Dr
- 15014 River Park Dr
- 11927 Oakcroft Dr
- 11715 Park Creek Dr
- 12023 Normont Dr
- 12126 Normont Dr
- 11814 Golden Pine Dr
- 15102 Rolling Oaks Dr
- 12102 Moorcreek Dr
- 12303 Christy Mill Ct
- 15215 River Park Dr
- 15207 Hillbrook Ct
- 15214 River Park Dr
- 12111 Moorcreek Dr
- 14907 Pine Point Ct
- 14927 Spring Lake Dr
- 14935 Spring Lake Dr
- 14923 Spring Lake Dr
- 14918 Long Oak Dr
- 14939 Spring Lake Dr
- 14914 Long Oak Dr
- 14930 Spring Lake Dr
- 14934 Spring Lake Dr
- 14926 Spring Lake Dr
- 14922 Long Oak Dr
- 14919 Spring Lake Dr
- 14922 Spring Lake Dr
- 14938 Spring Lake Dr
- 14910 Long Oak Dr
- 14915 Spring Lake Dr
- 14918 Spring Lake Dr
- 14923 Shady Bend Dr
- 14915 Shady Bend Dr
- 12002 Oak Bluff Dr
- 15002 Long Oak Dr