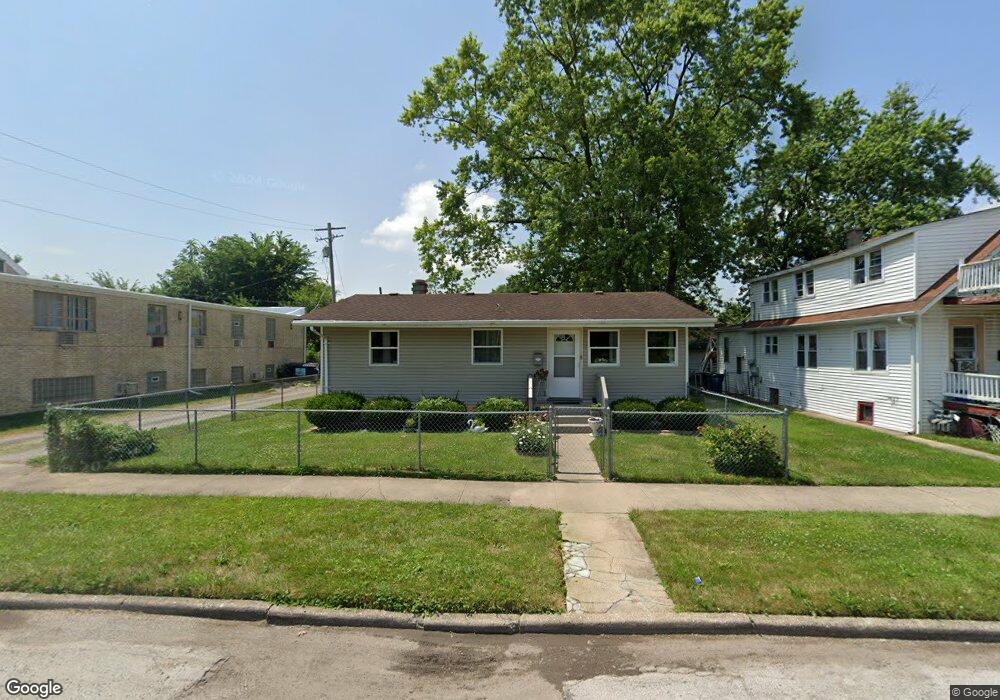
14932 Robey Ave Harvey, IL 60426
Estimated Value: $99,658 - $129,000
3
Beds
1
Bath
1,008
Sq Ft
$115/Sq Ft
Est. Value
About This Home
This home is located at 14932 Robey Ave, Harvey, IL 60426 and is currently estimated at $116,219, approximately $115 per square foot. 14932 Robey Ave is a home located in Cook County with nearby schools including Thornton Township High School and Academic Mastery Academy.
Ownership History
Date
Name
Owned For
Owner Type
Purchase Details
Closed on
Jul 25, 2007
Sold by
Chicago Title Land Trust Co
Bought by
Atenco Ticehuatl Arturo and Contreras Georgina
Current Estimated Value
Home Financials for this Owner
Home Financials are based on the most recent Mortgage that was taken out on this home.
Original Mortgage
$95,675
Outstanding Balance
$59,546
Interest Rate
6.69%
Mortgage Type
Purchase Money Mortgage
Estimated Equity
$56,673
Purchase Details
Closed on
Mar 13, 2007
Sold by
Deutsche Bank National Trust Co
Bought by
Chicago Title Land Trust and Trust #17620
Purchase Details
Closed on
Oct 25, 2006
Sold by
Cornelius Catheryn M and Johnson Catheryn M
Bought by
Deutsche Bank National Trust Co and Long Beach Mortgage Loan Trust 2002-5
Purchase Details
Closed on
Nov 25, 1987
Sold by
American National Bk & Tr Co Of Chicago
Bought by
Cornelius Arthur T and Johnson Catheryn M
Create a Home Valuation Report for This Property
The Home Valuation Report is an in-depth analysis detailing your home's value as well as a comparison with similar homes in the area
Home Values in the Area
Average Home Value in this Area
Purchase History
| Date | Buyer | Sale Price | Title Company |
|---|---|---|---|
| Atenco Ticehuatl Arturo | $107,500 | Chicago Title Land Trust Co | |
| Chicago Title Land Trust | $45,000 | Premier Title | |
| Deutsche Bank National Trust Co | -- | None Available | |
| Cornelius Arthur T | -- | -- |
Source: Public Records
Mortgage History
| Date | Status | Borrower | Loan Amount |
|---|---|---|---|
| Open | Atenco Ticehuatl Arturo | $95,675 |
Source: Public Records
Tax History
| Year | Tax Paid | Tax Assessment Tax Assessment Total Assessment is a certain percentage of the fair market value that is determined by local assessors to be the total taxable value of land and additions on the property. | Land | Improvement |
|---|---|---|---|---|
| 2025 | $1,264 | $3,442 | $1,083 | $2,359 |
| 2024 | $1,264 | $3,442 | $1,083 | $2,359 |
| 2023 | $401 | $3,442 | $1,083 | $2,359 |
| 2022 | $401 | $2,175 | $1,083 | $1,092 |
| 2021 | $430 | $2,173 | $1,082 | $1,091 |
| 2020 | $511 | $2,173 | $1,082 | $1,091 |
| 2019 | $1,022 | $2,975 | $984 | $1,991 |
| 2018 | $987 | $2,975 | $984 | $1,991 |
| 2017 | $994 | $2,975 | $984 | $1,991 |
| 2016 | $1,347 | $3,113 | $885 | $2,228 |
| 2015 | $1,252 | $3,113 | $885 | $2,228 |
| 2014 | $1,265 | $3,113 | $885 | $2,228 |
| 2013 | $1,482 | $3,641 | $885 | $2,756 |
Source: Public Records
Map
Nearby Homes
- 14826 Robey Ave
- 14919 Cooper Ave
- 15032 Winchester Ave
- 14806 Lincoln Ave
- 110 W 150th St
- 14910 S Wood St
- 14717 Hoyne Ave
- 15112 Honore Ave
- 15015 Wood St
- 15133 Honore Ave
- 14902 Paulina St
- 14652 Spaulding Ave
- 14807 Paulina St
- 14801 Paulina St
- 15033 Paulina St
- 14564 Spaulding Ave
- 15229 Honore Ave
- 36 W 151st St
- 15001 Western Ave
- 14540 Spaulding Ave
- 14932 Robey Ave
- 14926 Robey Ave
- 14920 Robey Ave
- 14920 Robey Ave
- 14922 Robey Ave
- 14922 Robey Ave
- 14933 Seeley Ave
- 14929 Seeley Ave
- 171 W 150th St
- 14925 Seeley Ave
- 14925 Seeley Ave
- 179 W 150th St
- 14924 Robey Ave
- 181 W 150th St
- 181 W 150th St
- 14919 Seeley Ave
- 14919 Seeley Ave
- 14919 Seeley Ave
- 14912 Robey Ave
- 14908 Robey Ave
Your Personal Tour Guide
Ask me questions while you tour the home.