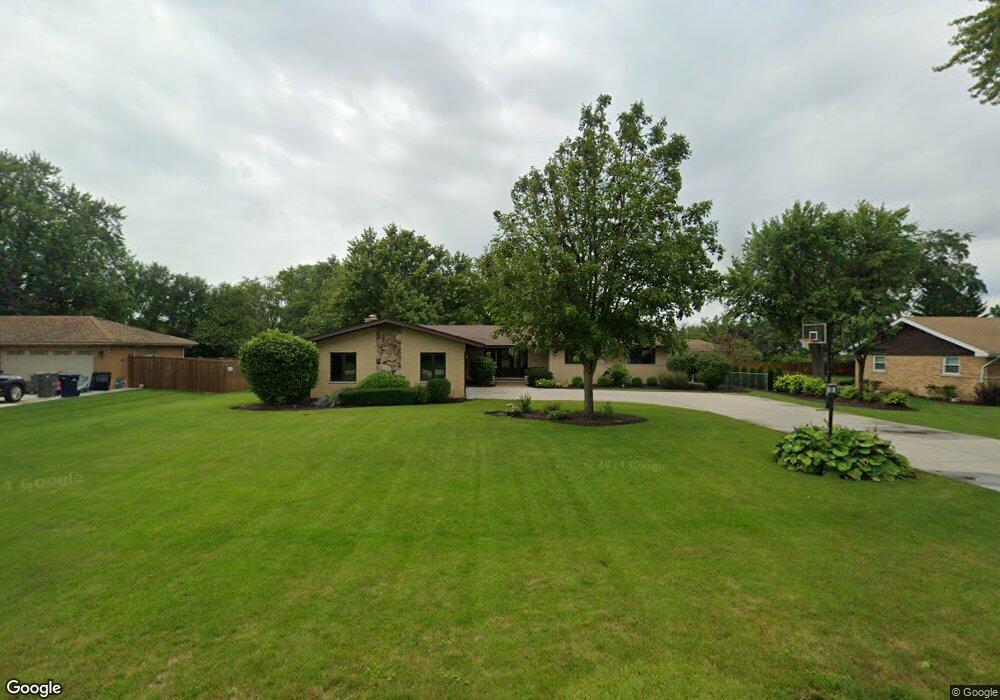
14932 S 81st Ct Orland Park, IL 60462
Silver Lake South NeighborhoodEstimated Value: $426,236 - $492,000
4
Beds
3
Baths
1,987
Sq Ft
$230/Sq Ft
Est. Value
About This Home
This home is located at 14932 S 81st Ct, Orland Park, IL 60462 and is currently estimated at $457,059, approximately $230 per square foot. 14932 S 81st Ct is a home located in Cook County with nearby schools including Prairie Elementary School, Liberty Elementary School, and Jerling Junior High School.
Ownership History
Date
Name
Owned For
Owner Type
Purchase Details
Closed on
Aug 29, 2018
Sold by
Pierson Daniel and Pierson Gerry Therese
Bought by
Asta O Rourke Daniel S and Rourke Asta O
Current Estimated Value
Home Financials for this Owner
Home Financials are based on the most recent Mortgage that was taken out on this home.
Original Mortgage
$170,000
Outstanding Balance
$149,108
Interest Rate
4.87%
Mortgage Type
New Conventional
Estimated Equity
$307,951
Purchase Details
Closed on
Mar 24, 2016
Sold by
Minnich Maureen T and Minnich Joseph
Bought by
Pierson Daniel and Pierson Gerry Therese
Home Financials for this Owner
Home Financials are based on the most recent Mortgage that was taken out on this home.
Original Mortgage
$300,000
Interest Rate
3.65%
Mortgage Type
Seller Take Back
Purchase Details
Closed on
Sep 16, 2008
Sold by
Reliance Trust Company
Bought by
Minnich Maureen
Purchase Details
Closed on
May 27, 1997
Sold by
Ruddy Eleanor J
Bought by
Ruddy Eleanor J and Eleanor J Ruddy Trust
Create a Home Valuation Report for This Property
The Home Valuation Report is an in-depth analysis detailing your home's value as well as a comparison with similar homes in the area
Home Values in the Area
Average Home Value in this Area
Purchase History
| Date | Buyer | Sale Price | Title Company |
|---|---|---|---|
| Asta O Rourke Daniel S | $370,000 | Old Republic Title | |
| Pierson Daniel | $300,000 | Chicago Title | |
| Minnich Maureen | $222,000 | Ticor | |
| Ruddy Eleanor J | -- | -- |
Source: Public Records
Mortgage History
| Date | Status | Borrower | Loan Amount |
|---|---|---|---|
| Open | Asta O Rourke Daniel S | $170,000 | |
| Previous Owner | Pierson Daniel | $300,000 |
Source: Public Records
Tax History Compared to Growth
Tax History
| Year | Tax Paid | Tax Assessment Tax Assessment Total Assessment is a certain percentage of the fair market value that is determined by local assessors to be the total taxable value of land and additions on the property. | Land | Improvement |
|---|---|---|---|---|
| 2024 | $6,862 | $29,928 | $8,170 | $21,758 |
| 2023 | $7,245 | $32,000 | $8,170 | $23,830 |
| 2022 | $7,245 | $26,561 | $7,148 | $19,413 |
| 2021 | $6,952 | $26,561 | $7,148 | $19,413 |
| 2020 | $6,718 | $26,561 | $7,148 | $19,413 |
| 2019 | $7,464 | $30,050 | $6,637 | $23,413 |
| 2018 | $7,231 | $30,050 | $6,637 | $23,413 |
| 2017 | $7,038 | $30,050 | $6,637 | $23,413 |
| 2016 | $6,683 | $26,697 | $6,127 | $20,570 |
| 2015 | $6,616 | $26,697 | $6,127 | $20,570 |
| 2014 | $6,518 | $26,697 | $6,127 | $20,570 |
| 2013 | $6,397 | $27,781 | $6,127 | $21,654 |
Source: Public Records
Map
Nearby Homes
- 14939 S 81st Ct
- 15024 S 81st Ave
- 7991 Forestview Dr
- 15102 S 82nd Ave
- 8035 Bob o Link Rd
- 7922 Sycamore Dr
- 15229 Bunker Dr
- 14567 S 82nd Ave
- 8215 Saint Andrews Dr
- 7809 Sycamore Dr
- 7712 Sequoia Ct
- 15426 S 82nd Ave
- 15233 Lawrence Ct
- 8005 W 143rd Place
- 15543 Brassie Dr
- 14255 Wedgewood Glens Dr
- 15624 Sunset Ridge Dr
- 8608 W 145th St
- 14712 S 88th Ave
- 7825 Braeloch Ct
- 14912 S 81st Ct
- 14940 S 81st Ct
- 14927 S 82nd Ave
- 14939 S 82nd Ave
- 14915 S 82nd Ave
- 14900 S 81st Ct
- 15000 S 81st Ct
- 14927 S 81st Ct
- 14915 S 81st Ct
- 14941 S 82nd Ave
- 14901 S 81st Ct
- 15019 S 81st Ct
- 15012 S 81st Ct
- 8140 Forestview Dr
- 14943 S 82nd Ave
- 15023 S 81st Ct
- 14924 S 81st Ave
- 14912 S 81st Ave
- 14950 S 81st Ave
- 8150 Forestview Dr